Automated Quantification of CD44, c-MET, EGFR, MTOR, and GLUT1 Expression in Head and Neck Squamous Cell Carcinoma: The Impact of p16 Status and Response to Chemoradiation
A B S T R A C T
This study assessed automated quantification of CD44, c-MET, MTOR, EGFR, and GLUT1 protein expression in a tissue microarray of 109 Stage II-IV p16 positive and negative head and neck squamous cell carcinomas (HNSCC) treated with definitive chemoradiation. Immunohistochemistry-based protein expression was quantified in an automated manner using digitally scanned images processed with Definiens Tissue Studio software to generate a histologic score (H-score, range 0-300) which was normalized for each biomarker. Biomarker expression levels were correlated with one another and with p16 status. Effects of biomarker and p16 status on locoregional control, disease-free survival, and overall survival were analyzed using Kaplan Meier and Cox proportional hazard modelling. There was a significant negative correlation between CD44 and p16 expression and significant positive correlations between CD44 and MTOR, CD44 and GLUT1, c-MET and MTOR, and MTOR and GLUT1. When patients were stratified by p16 status, the significant positive correlation between CD44 expression and MTOR remained for both the p16 positive and negative subsets, while correlations between CD44 and GLUT1 and c-MET and MTOR were seen in the p16 negative subset only. A significant correlation between MTOR and GLUT was seen overall and for the p16 positive subset. When the effects of biomarker expression on clinical endpoints were examined, histologic scores below the defined cut-points for CD44 and c-MET were each associated with improved locoregional control. Higher expressions of CD44, c-MET, EGFR, and GLUT1 were associated with inferior disease-free and overall survival. On multivariable analysis, p16 positivity remained independently associated with improved locoregional control, disease-free survival, and overall survival, high CD44 remained independently associated with inferior locoregional control, disease-free survival, and overall survival, and EGFR with inferior disease-free and overall survival. In conclusion, the use of an automated system to quantify IHC expression allowed objective correlation between biomarkers and stratification of patients, revealing that higher expressions of CD44, c-MET, EGFR, and GLUT1 were associated with poorer disease-free and overall survival.
Keywords
Head and neck cancer, image analysis, biomarkers, p16, chemoradiation
Introduction
Tissue microarrays (TMAs) can interrogate protein expression levels across many samples simultaneously and are therefore powerful tools to discover biomarkers with potential predictive or prognostic utility. Compared to the conventional immunohistochemistry (IHC) using individual tissue sections, TMAs facilitate high-throughput IHC analysis through their ability to combine many samples in a single slide, improving efficiency and eliminating possible variability in processing [1, 2]. Though they are subject to limitations, including loss of areas of heterogeneity from larger tissue blocks and the potential for variations in fixation and processing, their ability to facilitate high throughput makes them ideal for screening large numbers of specimens.
However, the ability to efficiently query multiple samples is still limited by quantification. Manual quantification through visual inspection is labor-intensive and also prone to issues with reproducibility due to its inherent subjectivity, limitations which are reduced or eliminated with automated analysis [1]. Therefore, efforts to establish a method for automated quantification have been the subject of multiple studies [3-5]. Several commercial platforms for automated analysis have also been developed [6]. While there are minor variations in these methods and commercial platforms, in general, they have the common benefits of improved efficiency and improved inter-experimental normalization.
The prognostic utility of biomarkers has played a major role in recent changes to staging and treatment in head and neck cancer (HNSCC). The prognostic value of HPV status in oropharyngeal cancer has led to multiple trials investigating the possibility of therapy de-escalation in this setting [7, 8]. Improved understanding of the prognostic value of additional biomarkers in this disease site may lead to further improvements in treatments and clinical outcomes.
Among previous research making use of automated quantification of biomarker expression levels in TMAs, there is limited literature on the validation of this technique using biomarkers with known clinical prognostic significance as defined by traditional, manual scoring of biomarker expression levels. Therefore, we analyzed the expression of several biomarkers in a TMA constructed from tissue samples from HNSCC patients treated with chemoradiation. We performed automated quantification of biomarkers as we had previously assessed these biomarkers for clinical prognostic significance using semi-quantitative visual inspection [9-11].
Materials and Methods
I Patient Selection and Generation of TMA
After approval from the Institutional Review Board, a tissue microarray was generated using tissue from pre-treatment biopsies of stage II-IV HNSCC patients as previously described [9]. Briefly, the representative areas of invasive carcinoma were marked by a pathologist, and two 1.0-mm tumor tissue samples were taken from each block and inserted onto the TMA. All patients had archived tissue available at our institution and were treated with chemoradiation from 2003 through 2011. A total of 109 patients were included.
Table 1: Baseline characteristics of the patient
population.
|
Parameter |
Classification |
Number |
% |
|
Age |
<50 |
17 |
15.6% |
|
50-59 |
32 |
29.4% |
|
|
60-69 |
33 |
30.3% |
|
|
70+ |
27 |
24.8% |
|
|
Race |
African American |
10 |
9.2% |
|
Caucasian |
99 |
90.8% |
|
|
Sex |
Female |
19 |
17.4% |
|
Male |
90 |
82.6% |
|
|
Tobacco use >10 pack years |
Yes |
69 |
63.3% |
|
No |
40 |
36.7% |
|
|
Primary Tumor |
Oral Cavity |
4 |
3.7% |
|
Oropharynx |
68 |
62.4% |
|
|
Hypopharynx |
7 |
6.4% |
|
|
Larynx |
30 |
27.5% |
|
|
T-Stage |
T1 |
16 |
14.7% |
|
T2 |
48 |
44.0% |
|
|
T3 |
27 |
24.8% |
|
|
T4 |
2 |
1.8% |
|
|
T4a |
12 |
11.0% |
|
|
T4b |
4 |
3.7% |
|
|
N-Stage |
N0 |
18 |
16.5% |
|
N1 |
15 |
13.8% |
|
|
N2a |
13 |
11.9% |
|
|
N2b |
38 |
34.9% |
|
|
N2c |
17 |
15.6% |
|
|
N3 |
8 |
7.3% |
|
|
Clinical Stage |
II |
6 |
5.5% |
|
III |
22 |
20.2% |
|
|
IVA |
70 |
64.2% |
|
|
IVB |
11 |
10.1% |
The patient characteristics are described in (Table 1). Chemotherapy was given at the discretion of the treating medical oncologist, and concurrent chemotherapy consisted of cisplatin (n=71), carboplatin (n=13), or cetuximab (n=25). Eighteen percent (n=19) received neoadjuvant chemotherapy consisting of docetaxel, cisplatin, and 5-fluorouracil. All patients received intensity-modulated radiation therapy with a simultaneous integrated boost technique with the dose prescribed to two planning target volumes. A dose of 70 Gy at 2 Gy per fraction was typically prescribed to the planning target volume (PTV1) encompassing the gross tumor volume, and 59.85 Gy at 1.71 Gy per fraction was prescribed to the planning target volume (PTV2) encompassing the uninvolved clinical target volume.
II Immunohistochemistry
IHC staining was performed on primary tumors by a horseradish peroxidase technique using either a DAKO Autostainer (DAKO, Hamburg, Germany) or Ventana Discovery XT (Ventana Inc., Tucson, AZ, USA) according to the manufacturer’s recommendation. Paraffin-embedded tissues mounted on slides were pre-treated for 30 min with an epitope target retrieval solution (DAKO). Slides were then subjected to an automatic staining procedure with standardized peroxidase blocking reagent. The following antibodies and concentrations were used: CD44 clone EPR1013Y (Abcam, Cambridge, MA, USA) diluted 1:50 and incubated at 42°C for 1 h; c-MET clone 8F11 (Vector Laboratories Inc., Burlingame, CA, USA) diluted 1:100 and incubated at 42°C for 2 h; a rabbit monoclonal (Y391) antibody against the C-terminal of human MTOR, used at a dilution of 1:400 after antigen retrieval with high pH conditions; EGFR clone 3C6 (Ventana Inc.) prediluted and incubated at 42°C for 30 min; GLUT1 (Abcam, Cambridge, MA, USA) diluted 1:300 and incubated at 42°C for 1 h; and HK2 clone Ab37593 (Abcam, Cambridge, MA, USA) diluted 1:20 and incubated at 42°C for 1 h. All antibodies were then visualized with 3,-3’-diaminobenzidine (DAB) chromogen, and hematoxylin was used for counterstaining.
III Quantification of IHC protein expression
High-resolution digital images were created by scanning slides for each biomarker using an Aperio Scan-Scope AT Turbo (Leica, Buffalo Grove, Illinois) at ×20 magnification and organized using Image Scope eSlide Manager (Leica) and TMA images were imported into Definiens Tissue Studio software (Definiens Inc., Cambridge, MA). Definiens uses a proprietary de-arraying algorithm consisting of three phases: TMA core segmentation, gridding, and mapping, which overcomes processing and sectioning artifacts and identifies and isolates each core. Within each core, a software algorithm was trained to automatically detect regions of interest (ROI), which were defined as viable tumor, non-tumor, white space, and artifacts (histological deposits, tissue folds etc.). Within the viable tumor ROI of each core, individual nuclei were detected based on hematoxylin staining. Cells were simulated around each nucleus based on the presence of a membrane. Algorithm IHC thresholds were then established to classify each cell based on its membrane, cytoplasmic, or nuclear stain intensity as negative, low, medium, or high. Once completed, the algorithm was applied objectively to each core. Data generated included the number of negative, low, medium, or high classified cells in each core. The histologic score (H-score) for each core was calculated as follows:
H-Score = (1 x % Cells Low) + (2 x % Cells Medium) + (3 x % Cells High)
The H-score is a combined parameter that corresponds to the percent positivity and intensity of expression within areas of tumor and has a range of 0-300. For p16 staining, positive expression was defined as diffuse 3+ staining (all 3+ cases demonstrated diffuse staining) or 2+ staining in 50% or more of tumor cells.
IV Statistics
H-scores were stratified by high and low expression using cut-points determined with ROC analysis. Biomarker expression levels measured using the H-score generally showed a normal distribution and were correlated with one another using the Pearson rank correlation. Biomarker expression levels were correlated with p16 status using Spearman's rank correlation. Effects of biomarker and p16 status on locoregional failure (LRF), disease-free survival (DFS), and overall survival (OS) were analyzed using Kaplan Meier and Cox proportional hazard modeling for uni- and multivariable analyses (UVA, MVA), respectively.
Results
I Baseline Patient Characteristics
The baseline characteristics of the patients are shown in (Table 1). Of the 109 patients included in this analysis, the majority had oropharynx primaries (62%), while larynx (28%), hypopharynx (6%) and oral cavity (4%) were also represented. The majority were clinical stage IVA (64%), according to AJCC version 7 staging. The median follow-up was 6.19 years, with a maximum of 13.46 years.
II Biomarker Analysis
Biomarker expression levels were correlated with one another and with p16 status. Using the H-score as a continuous variable, there was a significant negative correlation between CD44 expression and p16 status and a significant positive correlation between CD44 and both MTOR and GLUT1, c-MET and MTOR, and MTOR and GLUT1 (Table 2). When patients were stratified by p16 positive or negative status, the significant positive correlation between CD44 expression and MTOR remained for both the p16 positive and negative subsets, while correlations between CD44 and GLUT1 and c-MET and MTOR were seen in the p16-negative subset only. A significant correlation between MTOR and GLUT was seen overall and for the p16 positive subset. There were no significant correlations with EGFR. Figure 1 presents the IHC data as a heat map sorted by p16 status and CD44 expression, clearly showing the correlation between the two biomarkers.
Figure 1 presents the IHC data as a hierarchical cluster analysis for all the biomarkers and as a loading plot from principal component analysis (PCA) for p16- and p16+ tumors. The clustering and color map indicates that there are discernible associations between the biomarkers without a strong phenotype that emerges encompassing several biomarkers. The loading plot clearly highlights the different contributions of these biomarkers in p16- and p16+ patients.

Figure 1: Hierarchical clustering of A) protein expression values for all patients and B) loading plot from PCA analysis of p16- and p16+.
When correlations were assessed by disease site (oropharynx, larynx, or other), a significant correlation between CD44 and MTOR remained for both oropharynx and larynx; the correlations between CD44 and GLUT1 remained for oropharynx primaries only; the correlations between c-MET and MTOR and MTOR and GLUT remained for other primary sites only. There were significant correlations between EGFR and MTOR for oropharynx primaries and between c-MET and GLUT1 for other primary sites (Supplementary Table 1).
Table 2: Correlation analysis between the biomarkers. Data are presented for all
tumors and stratified by p16 status. Numbers in bold represent significant
correlations.
|
|
p16 |
CD44 |
C-MET |
EGFR |
MTOR |
|
CD44 all p16+ p16- |
0.28 (p=0.004) |
|
|
|
|
|
C-MET all p16+ p16- |
-0.08 (p=0.37) |
0.05 (p=0.61) 0.10 (p=0.49) 0.00 (p=0.997) |
|
|
|
|
EGFR all p16+ p16- |
-0.17 (p=0.08) |
0.02 (p=0.85) -0.20 (p=0.15) 0.11 (p=0.43) |
-0.03 (p=0.79) -0.02 (p=0.88) -0.044 (p=0.75) |
|
|
|
MTOR all p16+ p16- |
-0.12 (p=0.22) |
0.37 (p<0.001) 0.32 (p=0.02) 0.39 (p=0.004) |
0.24 (p=0.01) 0.16 (p=0.28) 0.03 (p=0.03) |
-0.11 (p=0.23) -0.24 (p=0.08) -0.05 (p=0.74) |
|
|
GLUT1 all p16+ p16- |
-0.12 (p=0.23) |
0.33 (p=0.001) 0.17 (p=0.21) 0.41 (p=0.005) |
0.05 (p=0.62) 0.08 (p=0.55) 0.01 (p=0.95) |
0.09 (p=0.36) -0.04 (p=0.77) 0.16 (p=0.28) |
0.30 (p=0.002) 0.30 (p=0.03) 0.28 (p=0.0.063) |
III Biomarkers and Clinical Outcomes
To examine the effects of biomarker status on clinical outcomes, ROC analysis was performed to stratify H-scores by high and low expression. Representative images of IHC staining for CD44, with corresponding H-scores stratified by the cut-point of 163, are shown in (Figure 2). The cut-off values for each biomarker as determined by ROC analysis comprised of an H-score greater than or equal to 163 for CD44, greater than or equal to 187 for c-MET, greater than or equal to 86 for mTOR, greater than or equal to 32 for EGFR, and greater than or equal to 202 for GLUT1. Fifty-one percent of the patients were p16 positive. The ROC cut-off values do not necessarily signify high or low expression, as was the case in our previous publications; it is the optimal value for statistical significance with regard to overall survival.
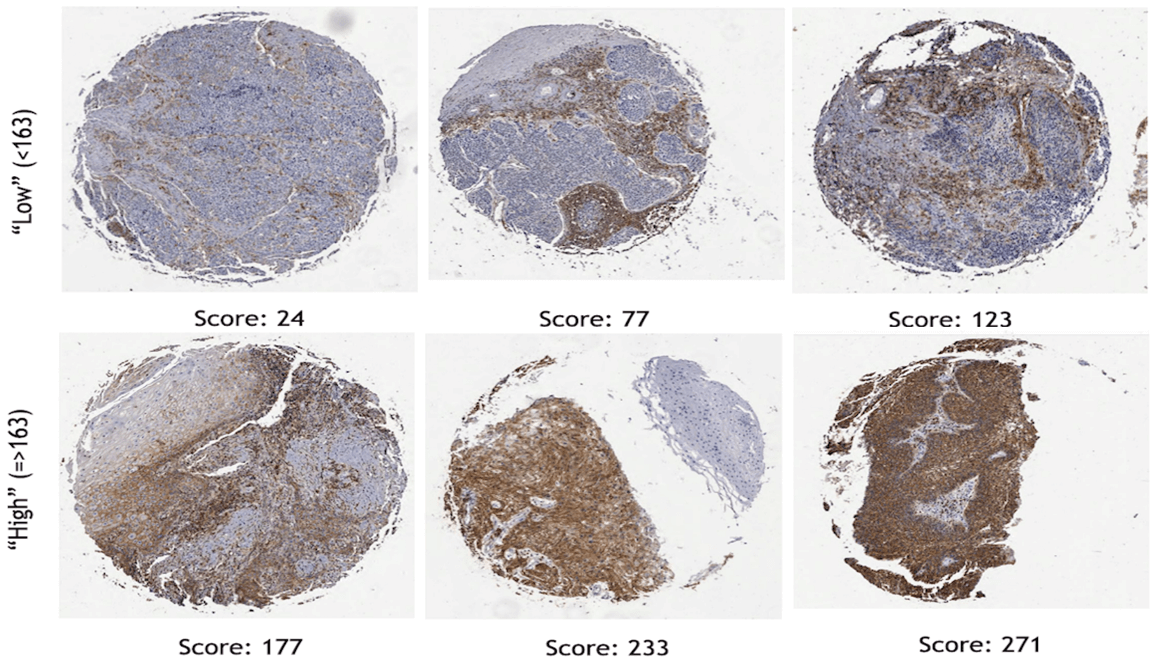
Figure 2: Examples of cores stained for CD44 displaying different staining characteristics. The numbers below each represent the H-score using definiens tissue studio analysis.
Table 3: Univariate analysis of selected clinicopathological features and
biomarkers. Significant parameters are highlighted in bold.
|
|
LRC |
DFS |
OS |
|||
|
HR (95% CI) |
p-value |
HR (95% CI) |
p-value |
HR (95% CI) |
p-value |
|
|
Age <50 vs 50-59 <50 vs 60-69 <50 vs 70+ |
1.0 (0.37-2.7) 0.48 (0.15-1.5) 1.0 (0.35-2.9) |
0.995 0.199 0.981 |
1.1 (0.47-2.3) 0.68 (0.30-1.6) 1.8 (0.84-4.0) |
0.910 0.372 0.131 |
0.94 (0.4-2.3) 0.64 (0.26-1.6) 2.53 (1.1-5.8) |
0.893 0.331 0.027 |
|
T stage (cT1-2 vs cT3-4) |
1.9 (0.95-3.9) |
0.068 |
1.8 (1.1-3.0) |
0.022 |
2.3 (1.4-4.0) |
0.002 |
|
N stage (cN0-2a vs cN2b-cN3) |
1.1 (0.55-2.3) |
0.741 |
1.3 (0.76-2.1) |
0.368 |
1.3 (0.74-2.2) |
0.383 |
|
Primary other vs oropharynx |
0.39 (0.19-0.80) |
0.010 |
0.34 (0.21-0.56) |
<0.001 |
0.31 (0.18-0.53) |
<0.001 |
|
p16 Negative vs Positive |
0.19 (0.08-0.45) |
<0.001 |
0.22 (0.13-0.38) |
<0.001 |
0.19 (0.10-0.36) |
<0.001 |
|
CD44 <163 => 163 |
4.0 (2.0-8.1) |
<0.001 |
3.0 (1.7-5.0) |
<0.001 |
3.0 (1.7-5.3) |
<0.001 |
|
c-MET <187 => 187 |
2.8 (1.3-5.6) |
0.006 |
1.8 (1.1-3.0) |
0.020 |
2.2 (1.3-3.7) |
0.005 |
|
MTOR < 86 => 86 |
1.5 (0.7-3.2) |
0.292 |
1.6 (0.9-2.8) |
0.085 |
1.6 (0.9-2.9) |
0.121 |
|
EGFR < 32 => 32 |
2.1 (0.9-4.6) |
0.079 |
2.0 (1.2-3.6) |
0.013 |
2.2 (1.2-4.0) |
0.014 |
|
GLUT1 <187 => 187 |
2.29 (1.1-5.0) |
0.038 |
2.41 (1.4-4.2) |
0.002 |
2.82 (1.6-5.0) |
<0.001 |
|
GLUT1 unknown |
3.03 (1.1-8.4) |
0.033 |
2.55 (1.2-5.6) |
0.019 |
3.17 (1.4-74) |
0.007 |
To identity the prognostic impact of baseline patient and biomarker expression on clinical outcomes, univariate analysis was performed (Table 3). Age less than 50 predicted for superior OS (HR: 2.53, 95% CI: 1.1-5.8, p = 0.027) compared to age 70 and above. Clinical T stage 1-2 predicted for better DFS (HR: 1.8, 95% CI: 1.1-3.0, p = 0.022) and OS (HR: 2.3, 95% CI: 1.4-4.0, p = 0.002) compared to clinical stage T3-4 tumors. Non-oropharynx primary tumor predicted for worse LRC, DFS, and OS (HR: 0.39, 95% CI: 0.19-0.80, p = 0.010; HR: 0.34, 95% CI: 0.21-0.56, p < 0.0001; and HR: 0.31, 95% CI: 0.18-0.53, p < 0.0001) compared to oropharynx primaries. As expected, p16-negative status predicted for worse LRC, DFS, and OS (HR: 0.19, 95% CI: 0.08-0.45, p < 0.0001; HR: 0.22, 95% CI: 0.13-0.38, p < 0.0001; and HR: 0.19, 95% CI: 0.10-0.36, p < 0.0001) compared to p16-positive status.
The prognostic impact of each biomarker expression levels on clinical outcomes are also presented in (Table 3). On univariate analysis, higher CD44 expression predicted for worse LRC (HR: 4.0, 95% CI: 2.0-8.1, p < 0.001), DFS (HR: 3.0, 95% CI: 1.7-5.0, p < 0.0001), and OS (HR: 3.0, 95% CI: 1.7-5.3, p < 0.0001). Higher c-MET expression also predicted for worse LRC (HR: 2.8, 95% CI: 1.3-5.6, p = 0.006), DFS (HR: 1.8, 95% CI: 1.1.3.0, p = 0.020), and OS (HR: 2.2, 95% CI: 1.3-3.7, p = 0.005). Higher EGFR expression was also predictive for worse DFS (HR: 2.0, 95% CI: 1.2-3.6, p = 0.013) and OS (HR: 2.2, 95% CI: 1.2-4.0, p = 0.014), but not LRC, and similarly, higher GLUT1 expression predicted for poorer LRC (HR: 2.3, 95% CI: 1.1-5.0, p = 0.038), DFS (HR: 2.4, 95% CI: 14-4.2, p = 0.002), and OS (HR: 2.8 95% CI: 1.6-5.0, p < 0.0001).
Due to the fact that p16 positive HNSCC is known to have a more favorable clinical course and response to treatment as compared to p16 negative tumors, we also assessed the influence of biomarker expression levels on our clinical endpoints as a function of p16 status (Figure 3) [12]. With the exception of CD44, which was significantly predictive for LRC and DFS in the p16 negative subset and for OS in the p16 positive subset, and GLUT1, which was significantly predictive for OS in the p16 positive subset, the majority of biomarkers were no longer significantly predictive for LRC, DFS, or OS. This is possibly explained by the reduced number of patients in the p16 positive and negative subsets.
On multivariable analysis, p16 remained independently associated with improved LRC, DFS, and OS (HRs 0.25, 95% CI 0.1-0.7; 0.25, 95% CI 0.1-0.5; 0.25, 95% CI 0.1-0.5). Higher CD44 also remained independently associated with inferior LRC, DFS, and OS (HRs 2.8, 95% CI 1.2-6.7; 1.9, 95% CI 1.0-3.5; 2.2, 95% CI 1.1-4.2), while higher EGFR was independently associated with inferior DFS and OS (HRs 1.95, 95% CI 1.1-3.6; 2.2, 95% CI 1.1-4.3) and c-MET with OS (HR 1.91, 95% CI 1.0-3.6). Meanwhile, GLUT1 was not independently associated with any clinical outcome (Table 4). If MVA was adjusted for T stage and p16 status, CD44 expression (p = 0.015) and high EGFR expression (p = 0.049) predicted for significantly worse DFS, while high c-MET expression (p = 0.294) and high GLUT1 expression (p = 0.667) did not (data not shown).
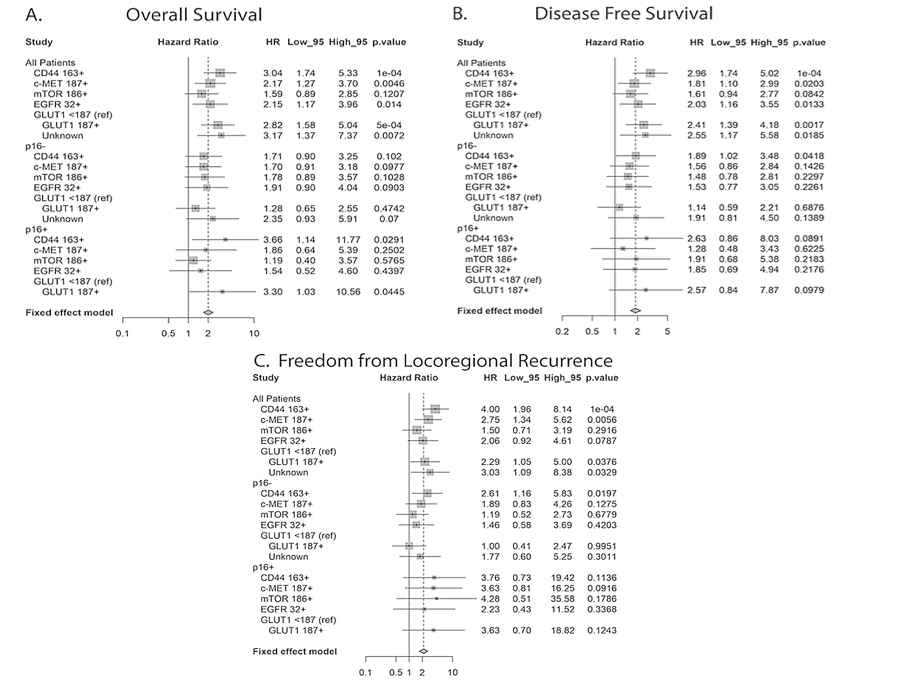
Figure 3: Hazard ratio analysis for all tumors and as a function of A) p16 status for overall survival, B) disease-free survival and C) locoregional control.
Table 4: Multivariate analysis of LRC, DFS and OS. Significant parameters are highlighted in bold.
|
|
LRC |
DFS |
OS |
|||
|
Variable |
HR (95% CI) |
p-value |
HR (95% CI) |
p-value |
HR (95% CI) |
p-value |
|
Age <50 vs 50-59 |
0.68 (0.23, 1.99) |
0.48 |
0.61 (0.25, 1.49) |
0.28 |
0.57 (0.22, 1.48) |
0.25 |
|
Age <50 vs 60-69 |
0.60 (0.18, 2.01) |
0.41 |
0.56 (0.23, 1.36) |
0.20 |
0.64 (0.24, 1.69) |
0.37 |
|
Age <50 vs 70 |
0.67 (0.22, 2.02) |
0.47 |
1.00 (0.44, 2.28) |
>0.99 |
1.68 (0.70, 3.99) |
0.24 |
|
Clinical T Stage cT1-2 vs cT3-4 |
1.36 (0.64, 2.88) |
0.42 |
1.21 (0.71, 2.07) |
0.48 |
1.70 (0.95, 3.04) |
0.072 |
|
p16 Status negative vs positive |
0.25 (0.10, 0.68) |
0.006 |
0.25 (0.13, 0.49) |
<0.001 |
0.25 (0.12, 0.52) |
<0.001 |
|
CD44 Score <163 vs 163+ |
2.78 (1.16, 6.65) |
0.022 |
1.86 (1.00, 3.47) |
0.050 |
2.15 (1.11, 4.15) |
0.023 |
|
c-MET Score <187 vs 187+ |
2.10 (0.91, 4.84) |
0.082 |
1.41 (0.78, 2.53) |
0.26 |
1.91 (1.02, 3.57) |
0.044 |
|
MTOR Score <86 vs 86+ |
1.37 (0.55, 3.44) |
0.50 |
1.54 (0.80, 2.97) |
0.20 |
1.25 (0.61, 2.57) |
0.54 |
|
EGFR Score <32 vs 32+ |
2.07 (0.83, 5.14) |
0.12 |
1.95 (1.05, 3.60) |
0.034 |
2.19 (1.12, 4.28) |
0.022 |
|
GLUT1 Score <187 vs 202+ |
0.51 (0.18, 1.45) |
0.21 |
0.56 (0.26, 1.19) |
0.13 |
0.61 (0.28, 1.30) |
0.20 |
|
GLUT1 <187 vs unknown |
0.78 (0.21, 2.87) |
0.70 |
0.89 (0.35, 2.27) |
0.81 |
1.22 (0.46, 3.22) |
0.69 |
Discussion
In this study, we have developed a quantitative image analysis approach to analyze known biomarkers in HNSCC that allowed us to more accurately study their correlation with one another and investigate their association with clinical outcomes in p16+ and p16- HNSCCs. We had previously analyzed these biomarkers using visual analysis carried out by two or three independent observers [9-11, 13]. The results of this present analysis generally correspond with our previous findings, although differences did arise. The differences were attributed to the different methods in scoring and in determining the cut-points for analysis. Using visual scoring methods, the data was generally classified as high or low expression based on semi-quantitative scoring and grouping of these scores. The grouping of scores varied depending on the marker, i.e., in some cases it was 1 and 2 versus 3 whilst in others it 0 and 1 versus 2 and 3. The grouping then determined the distribution of data for correlation analysis (using a Chi-squared analysis for ordinal data) and for analysis of clinical outcome parameters. The methodology in this study allowed a more robust correlation between biomarker expression as the values basically became a continuous variable.
An important point to note is that the use of the terms high or low expression in this current study is not relevant. The cut-offs were determined statistically, providing the optimal segregation of the data with reference to overall survival. In some cases, the cut-off was close to the median value (e.g., CMET 187 by ROC versus a median of 170), while in other cases it was not (e.g., CD44 163 by ROC versus a median of 103). Supplementary Table 2 presents the clinical outcome data using the median value for each biomarker and highlights the dependence of clinical significance on the choice of cut-off. However, using the more rigorous cut-offs for the biomarkers based on ROC analysis rather than a semi-quantitative classification, we were able to confirm the prognostic significance of high expression levels of CD44 and CMET for worse LRC, DFS and OS, as well as high EGFR or GLUT1 expression predicting for worse DFS and OS but not LRC.
The correlation between the biomarkers and p16 status yielded new data. As p16 serves as a surrogate for HPV status, this added to knowledge concerning the difference between HPV-driven tumors compared to HPV negative tumors. These two HNSCC subtypes have distinct etiologies, molecular properties, clinical features, and prognostic outcomes [14-16]. Differences in the molecular landscapes of HPV-driven and HPV-negative HNSCC occur genome-wide and encompass changes in genomic, epigenetic, and transcriptional landscapes [17, 18]. The mutational load and spectrum differ between these two subtypes, with HPV+ cancers characterized by a lower mutational burden, with the most common mutations in PIK3CA, IGFR1, EPHA2, DDR2, KEAP1, NOTCH1, FGFR2, and FGFR3 [19, 20]. Mutations TP53, FADD, CCDN1, CDKN2A, FAT1, NOTCH1, MYC, and PIK3CA dominate in HPV- tumors [19, 20]. Interestingly, there was no difference in expression levels of MTOR, CMET or EGFR between p16+ and p16- tumors.
However, mean CD44 expression was significantly higher (p = 0.004) in p16- tumors (median 116; interquartile range (IQR) 63, 170) compared to p16+ tumors (median 75; IQR 35, 124). Also, GLUT1 (which serves as a hypoxia marker), was significantly (p < 0.001) higher in p16- tumors (median 156; IQR 72, 192) versus p16+ tumors (median 98; IQR 63, 159). High expression of both of these biomarkers (CD44 and GLUT1) was associated with poorer overall survival in all patients and also retained significance in the p16+ group (Figure 2) [21]. In addition, there was a significant correlation between CD44 and GLUT1 (Table 2); a previous study had noted a strong correlation between CD44 and hypoxia gene signatures in HPV- HNSCC [22].
CD44 was also strongly correlated with MTOR (Table 2), and this correlation was significant irrespective of p16 status. The link between CD44 and MTOR has been reported in several recent studies in the context of cancer stem cells (CSCs) [23-28]. Rapamycin inhibition of the MTOR signaling pathway downregulated cancer stem cell properties of nasopharyngeal carcinoma, and anti-CD44 antibodies inhibit both mTORC1 and mTORC2 in acute myeloid leukemia [23, 24]. A molecular link was discovered between the PI3K/AKT/MTOR signaling pathway and CSCs, characterized by high CD44 and aldehyde dehydrogenase (ALDH) activity, in patient-derived xenografts from patients with both HPV positive and negative HNSCC [29].
Given the evidence that CD44 is consistently associated with a poor prognosis in HNSCC and its established role in treatment-resistant cancer stem cells in HNSCC, it is somewhat surprising that therapeutic strategies targeting this molecule are lacking in solid tumors [30-37]. However, several novel strategies using nanoparticles and targeting miRNAs are being developed [38-41].
Multiple methods for automated quantification of biomarker expression within TMAs have been established, with the common objective to reduce the time-consuming nature and potential biases of semi-quantification by visual inspection. While some have been developed for general quantification, others have been created for more specific purposes, such as measuring changes in the subcellular location of biomarkers, where the ability to eliminate the bias inherent to visual inspection may be of particular importance [3-5]. While automated quantification has been used previously to correlate biomarker expression levels with clinical prognostic factors in human tumor specimens, to our knowledge, this is the first study that used automated analysis to interrogate the potential prognostic significance of biomarkers using a TMA and biomarkers which had previously been shown to have significant prognostic value using semi-quantitative visual inspection [42]. Specifically, we used Definiens Tissue Studio, which uses feature-based or contextual compartmentalization to train the software to recognize areas of interest for analysis and which is one of several commercially available image analysis software with the potential to allow high-throughput analysis in IHC [6].
In conclusion, we performed automated quantification of CD44, c-MET, MTOR, EGFR, and GLUT1 expression in HNSCC samples from patients who underwent definitive chemoradiation. Our analysis shows that higher expression of CD44, c-MET, EGFR, and GLUT1 were associated with inferior DFS and OS, while MTOR expression levels did not correlate with any clinical endpoints. The trend for OS and DFS remained significant for CD44 and EGFR but not for c-MET or GLUT1 on MVA. This confirms findings reported in our previously published studies using this same TMA and highlights the importance of CD44 expression in both p16 positive and negative subtypes of HNSCC.
Conflicts of Interest
None.
Acknowledgments
Funding was provided by the Beaumont Health System Department of Radiation Oncology. The authors thank Barbara Pruetz and the Beaumont BioBank for specimen cutting and processing.
Author Contributions
A.B. generated the tissue microarray. A.B., J.A., and T.Q. collected and updated clinical outcome data. T.W., A.H., and K.B. carried out the IH and automated protein expression quantification. T.Q., T.W., and J.A. performed statistical analyses. J.A. wrote the manuscript with the support and involved of the remaining authors. All authors had final approval of the submitted version. R.D. helped supervise the project. G.W. conceived the original idea and supervised the project.
Supplementary Table 1: Correlation analysis between the biomarkers for each
disease sub-site: oropharynx (n=68), larynx (n=30), and all other disease sites
(n=11, oral cavity and hypo pharynx combined). Numbers in bold represent
significant correlations. Correlation by p16 status could not be performed for
the other sub-site category as all samples in this group were p16 negative.
|
Oropharynx |
p16 |
CD44 |
C.MET |
EGFR |
mTOR |
|
CD44
|
-0.200 (p=0.102) |
— |
|
|
|
|
C.MET |
-0.008 (p=0.946) |
-0.049 (p=0.690) |
— |
|
|
|
EGFR
|
-0.093 (p=0.449) |
-0.160 (p=0.193) |
-0.184 (p=0.133) |
— |
|
|
mTOR
|
0.009 (p=0.944) |
0.350 (p=0.003) |
0.161 (p=0.191) |
-0.242 (p=0.047) |
— |
|
GLUT1 |
0.101 (p=0.414) |
0.321 (p=0.008) |
-0.211 (p=0.083) |
0.095 (p=0.442) |
0.205 (p=0.093) |
|
Larynx |
p16 |
CD44 |
C.MET |
EGFR |
mTOR |
|
CD44 |
-0.054 (p=0.775) |
— |
|
|
|
|
C.MET |
0.008 (p=0.965) |
0.156 (p=0.410) |
— |
|
|
|
EGFR |
-0.025 (p=0.896) |
0.088 (p=0.643) |
0.017 (p=0.931) |
— |
|
|
mTOR |
-0.154 (p=0.415) |
0.471 (p=0.009) |
0.169 (p=0.373) |
0.012 (p=0.951) |
— |
|
GLUT1 |
-0.138 (p=0.467) |
0.109 (p=0.566) |
0.101 (p=0.596) |
0.163 (p=0.388) |
0.310 (p=0.095) |
|
Other |
p16 |
CD44 |
C.MET |
EGFR |
mTOR |
|
CD44 |
n/a |
— |
|
|
|
|
C.MET |
n/a |
-0.165 (p=0.627) |
— |
|
|
|
EGFR |
n/a |
0.159 (p=0.640) |
0.197 (p=0.562) |
— |
|
|
mTOR |
n/a |
0.178 (p=0.600) |
0.787 (p=0.004) |
0.176 (p=0.604) |
— |
|
GLUT1 |
n/a |
-0.332 (p=0.319) |
0.8718 (p=0.0005) |
0.233 (p=0.490) |
0.771 (p=0.005) |
Supplementary Table 2: Univariate analysis of clinical outcome parameters
using the median value for each biomarker.
|
|
LRF |
DFS |
OS |
|||
|
|
HR (95% CI) |
p-value |
HR (95% CI) |
p-value |
HR (95% CI) |
p-value |
|
p16 |
0.21 (0.08 - 0.52) |
0.001 |
0.14 (0.06 - 0.32) |
<0.001 |
0.14 (0.06 - 0.33) |
<0.001 |
|
CD44 |
0.57 (0.24 - 1.31) |
0.2 |
0.53 (0.24 - 1.13) |
0.10 |
0.53 (0.25 - 1.14) |
0.11 |
|
c-MET |
0.45 (0.19 - 1.04) |
0.064 |
0.88 (0.41 - 1.88) |
0.8 |
0.67 (0.31 - 1.42) |
0.3 |
|
mTOR |
1.03 (0.45 - 2.35) |
>0.9 |
0.77 (0.36 - 1.65) |
0.5 |
0.77 (0.36 - 1.64) |
0.5 |
|
EGFR |
1.23 (0.54 - 2.82) |
0.6 |
0.57 (0.27 - 1.22) |
0.2 |
0.49 (0.23 - 1.05) |
0.069 |
|
GLUT1 |
1.23 (0.54 - 2.82) |
0.6 |
0.57 (0.27 - 1.22) |
0.2 |
0.57 (0.27 - 1.22) |
0.2 |
Article Info
Article Type
Research ArticlePublication history
Received: Wed 13, May 2020Accepted: Mon 01, Jun 2020
Published: Fri 12, Jun 2020
Copyright
© 2023 George Wilson. This is an open-access article distributed under the terms of the Creative Commons Attribution License, which permits unrestricted use, distribution, and reproduction in any medium, provided the original author and source are credited. Hosting by Science Repository.DOI: 10.31487/j.COR.2020.06.03
Figures & Tables
Table 1: Baseline characteristics of the patient
population.
|
Parameter |
Classification |
Number |
% |
|
Age |
<50 |
17 |
15.6% |
|
50-59 |
32 |
29.4% |
|
|
60-69 |
33 |
30.3% |
|
|
70+ |
27 |
24.8% |
|
|
Race |
African American |
10 |
9.2% |
|
Caucasian |
99 |
90.8% |
|
|
Sex |
Female |
19 |
17.4% |
|
Male |
90 |
82.6% |
|
|
Tobacco use >10 pack years |
Yes |
69 |
63.3% |
|
No |
40 |
36.7% |
|
|
Primary Tumor |
Oral Cavity |
4 |
3.7% |
|
Oropharynx |
68 |
62.4% |
|
|
Hypopharynx |
7 |
6.4% |
|
|
Larynx |
30 |
27.5% |
|
|
T-Stage |
T1 |
16 |
14.7% |
|
T2 |
48 |
44.0% |
|
|
T3 |
27 |
24.8% |
|
|
T4 |
2 |
1.8% |
|
|
T4a |
12 |
11.0% |
|
|
T4b |
4 |
3.7% |
|
|
N-Stage |
N0 |
18 |
16.5% |
|
N1 |
15 |
13.8% |
|
|
N2a |
13 |
11.9% |
|
|
N2b |
38 |
34.9% |
|
|
N2c |
17 |
15.6% |
|
|
N3 |
8 |
7.3% |
|
|
Clinical Stage |
II |
6 |
5.5% |
|
III |
22 |
20.2% |
|
|
IVA |
70 |
64.2% |
|
|
IVB |
11 |
10.1% |
Table 2: Correlation analysis between the biomarkers. Data are presented for all
tumors and stratified by p16 status. Numbers in bold represent significant
correlations.
|
|
p16 |
CD44 |
C-MET |
EGFR |
MTOR |
|
CD44 all p16+ p16- |
0.28 (p=0.004) |
|
|
|
|
|
C-MET all p16+ p16- |
-0.08 (p=0.37) |
0.05 (p=0.61) 0.10 (p=0.49) 0.00 (p=0.997) |
|
|
|
|
EGFR all p16+ p16- |
-0.17 (p=0.08) |
0.02 (p=0.85) -0.20 (p=0.15) 0.11 (p=0.43) |
-0.03 (p=0.79) -0.02 (p=0.88) -0.044 (p=0.75) |
|
|
|
MTOR all p16+ p16- |
-0.12 (p=0.22) |
0.37 (p<0.001) 0.32 (p=0.02) 0.39 (p=0.004) |
0.24 (p=0.01) 0.16 (p=0.28) 0.03 (p=0.03) |
-0.11 (p=0.23) -0.24 (p=0.08) -0.05 (p=0.74) |
|
|
GLUT1 all p16+ p16- |
-0.12 (p=0.23) |
0.33 (p=0.001) 0.17 (p=0.21) 0.41 (p=0.005) |
0.05 (p=0.62) 0.08 (p=0.55) 0.01 (p=0.95) |
0.09 (p=0.36) -0.04 (p=0.77) 0.16 (p=0.28) |
0.30 (p=0.002) 0.30 (p=0.03) 0.28 (p=0.0.063) |
Table 3: Univariate analysis of selected clinicopathological features and
biomarkers. Significant parameters are highlighted in bold.
|
|
LRC |
DFS |
OS |
|||
|
HR (95% CI) |
p-value |
HR (95% CI) |
p-value |
HR (95% CI) |
p-value |
|
|
Age <50 vs 50-59 <50 vs 60-69 <50 vs 70+ |
1.0 (0.37-2.7) 0.48 (0.15-1.5) 1.0 (0.35-2.9) |
0.995 0.199 0.981 |
1.1 (0.47-2.3) 0.68 (0.30-1.6) 1.8 (0.84-4.0) |
0.910 0.372 0.131 |
0.94 (0.4-2.3) 0.64 (0.26-1.6) 2.53 (1.1-5.8) |
0.893 0.331 0.027 |
|
T stage (cT1-2 vs cT3-4) |
1.9 (0.95-3.9) |
0.068 |
1.8 (1.1-3.0) |
0.022 |
2.3 (1.4-4.0) |
0.002 |
|
N stage (cN0-2a vs cN2b-cN3) |
1.1 (0.55-2.3) |
0.741 |
1.3 (0.76-2.1) |
0.368 |
1.3 (0.74-2.2) |
0.383 |
|
Primary other vs oropharynx |
0.39 (0.19-0.80) |
0.010 |
0.34 (0.21-0.56) |
<0.001 |
0.31 (0.18-0.53) |
<0.001 |
|
p16 Negative vs Positive |
0.19 (0.08-0.45) |
<0.001 |
0.22 (0.13-0.38) |
<0.001 |
0.19 (0.10-0.36) |
<0.001 |
|
CD44 <163 => 163 |
4.0 (2.0-8.1) |
<0.001 |
3.0 (1.7-5.0) |
<0.001 |
3.0 (1.7-5.3) |
<0.001 |
|
c-MET <187 => 187 |
2.8 (1.3-5.6) |
0.006 |
1.8 (1.1-3.0) |
0.020 |
2.2 (1.3-3.7) |
0.005 |
|
MTOR < 86 => 86 |
1.5 (0.7-3.2) |
0.292 |
1.6 (0.9-2.8) |
0.085 |
1.6 (0.9-2.9) |
0.121 |
|
EGFR < 32 => 32 |
2.1 (0.9-4.6) |
0.079 |
2.0 (1.2-3.6) |
0.013 |
2.2 (1.2-4.0) |
0.014 |
|
GLUT1 <187 => 187 |
2.29 (1.1-5.0) |
0.038 |
2.41 (1.4-4.2) |
0.002 |
2.82 (1.6-5.0) |
<0.001 |
|
GLUT1 unknown |
3.03 (1.1-8.4) |
0.033 |
2.55 (1.2-5.6) |
0.019 |
3.17 (1.4-74) |
0.007 |
Table 4: Multivariate analysis of LRC, DFS and OS. Significant parameters are highlighted in bold.
|
|
LRC |
DFS |
OS |
|||
|
Variable |
HR (95% CI) |
p-value |
HR (95% CI) |
p-value |
HR (95% CI) |
p-value |
|
Age <50 vs 50-59 |
0.68 (0.23, 1.99) |
0.48 |
0.61 (0.25, 1.49) |
0.28 |
0.57 (0.22, 1.48) |
0.25 |
|
Age <50 vs 60-69 |
0.60 (0.18, 2.01) |
0.41 |
0.56 (0.23, 1.36) |
0.20 |
0.64 (0.24, 1.69) |
0.37 |
|
Age <50 vs 70 |
0.67 (0.22, 2.02) |
0.47 |
1.00 (0.44, 2.28) |
>0.99 |
1.68 (0.70, 3.99) |
0.24 |
|
Clinical T Stage cT1-2 vs cT3-4 |
1.36 (0.64, 2.88) |
0.42 |
1.21 (0.71, 2.07) |
0.48 |
1.70 (0.95, 3.04) |
0.072 |
|
p16 Status negative vs positive |
0.25 (0.10, 0.68) |
0.006 |
0.25 (0.13, 0.49) |
<0.001 |
0.25 (0.12, 0.52) |
<0.001 |
|
CD44 Score <163 vs 163+ |
2.78 (1.16, 6.65) |
0.022 |
1.86 (1.00, 3.47) |
0.050 |
2.15 (1.11, 4.15) |
0.023 |
|
c-MET Score <187 vs 187+ |
2.10 (0.91, 4.84) |
0.082 |
1.41 (0.78, 2.53) |
0.26 |
1.91 (1.02, 3.57) |
0.044 |
|
MTOR Score <86 vs 86+ |
1.37 (0.55, 3.44) |
0.50 |
1.54 (0.80, 2.97) |
0.20 |
1.25 (0.61, 2.57) |
0.54 |
|
EGFR Score <32 vs 32+ |
2.07 (0.83, 5.14) |
0.12 |
1.95 (1.05, 3.60) |
0.034 |
2.19 (1.12, 4.28) |
0.022 |
|
GLUT1 Score <187 vs 202+ |
0.51 (0.18, 1.45) |
0.21 |
0.56 (0.26, 1.19) |
0.13 |
0.61 (0.28, 1.30) |
0.20 |
|
GLUT1 <187 vs unknown |
0.78 (0.21, 2.87) |
0.70 |
0.89 (0.35, 2.27) |
0.81 |
1.22 (0.46, 3.22) |
0.69 |
Supplementary Table 1: Correlation analysis between the biomarkers for each
disease sub-site: oropharynx (n=68), larynx (n=30), and all other disease sites
(n=11, oral cavity and hypo pharynx combined). Numbers in bold represent
significant correlations. Correlation by p16 status could not be performed for
the other sub-site category as all samples in this group were p16 negative.
|
Oropharynx |
p16 |
CD44 |
C.MET |
EGFR |
mTOR |
|
CD44
|
-0.200 (p=0.102) |
— |
|
|
|
|
C.MET |
-0.008 (p=0.946) |
-0.049 (p=0.690) |
— |
|
|
|
EGFR
|
-0.093 (p=0.449) |
-0.160 (p=0.193) |
-0.184 (p=0.133) |
— |
|
|
mTOR
|
0.009 (p=0.944) |
0.350 (p=0.003) |
0.161 (p=0.191) |
-0.242 (p=0.047) |
— |
|
GLUT1 |
0.101 (p=0.414) |
0.321 (p=0.008) |
-0.211 (p=0.083) |
0.095 (p=0.442) |
0.205 (p=0.093) |
|
Larynx |
p16 |
CD44 |
C.MET |
EGFR |
mTOR |
|
CD44 |
-0.054 (p=0.775) |
— |
|
|
|
|
C.MET |
0.008 (p=0.965) |
0.156 (p=0.410) |
— |
|
|
|
EGFR |
-0.025 (p=0.896) |
0.088 (p=0.643) |
0.017 (p=0.931) |
— |
|
|
mTOR |
-0.154 (p=0.415) |
0.471 (p=0.009) |
0.169 (p=0.373) |
0.012 (p=0.951) |
— |
|
GLUT1 |
-0.138 (p=0.467) |
0.109 (p=0.566) |
0.101 (p=0.596) |
0.163 (p=0.388) |
0.310 (p=0.095) |
|
Other |
p16 |
CD44 |
C.MET |
EGFR |
mTOR |
|
CD44 |
n/a |
— |
|
|
|
|
C.MET |
n/a |
-0.165 (p=0.627) |
— |
|
|
|
EGFR |
n/a |
0.159 (p=0.640) |
0.197 (p=0.562) |
— |
|
|
mTOR |
n/a |
0.178 (p=0.600) |
0.787 (p=0.004) |
0.176 (p=0.604) |
— |
|
GLUT1 |
n/a |
-0.332 (p=0.319) |
0.8718 (p=0.0005) |
0.233 (p=0.490) |
0.771 (p=0.005) |
Supplementary Table 2: Univariate analysis of clinical outcome parameters
using the median value for each biomarker.
|
|
LRF |
DFS |
OS |
|||
|
|
HR (95% CI) |
p-value |
HR (95% CI) |
p-value |
HR (95% CI) |
p-value |
|
p16 |
0.21 (0.08 - 0.52) |
0.001 |
0.14 (0.06 - 0.32) |
<0.001 |
0.14 (0.06 - 0.33) |
<0.001 |
|
CD44 |
0.57 (0.24 - 1.31) |
0.2 |
0.53 (0.24 - 1.13) |
0.10 |
0.53 (0.25 - 1.14) |
0.11 |
|
c-MET |
0.45 (0.19 - 1.04) |
0.064 |
0.88 (0.41 - 1.88) |
0.8 |
0.67 (0.31 - 1.42) |
0.3 |
|
mTOR |
1.03 (0.45 - 2.35) |
>0.9 |
0.77 (0.36 - 1.65) |
0.5 |
0.77 (0.36 - 1.64) |
0.5 |
|
EGFR |
1.23 (0.54 - 2.82) |
0.6 |
0.57 (0.27 - 1.22) |
0.2 |
0.49 (0.23 - 1.05) |
0.069 |
|
GLUT1 |
1.23 (0.54 - 2.82) |
0.6 |
0.57 (0.27 - 1.22) |
0.2 |
0.57 (0.27 - 1.22) |
0.2 |
References
1. Giltnane JM, Rimm DL (2004) Technology Insight: Identification of Biomarkers With Tissue Microarray Technology. Nat Clin Pract Oncol 1: 104-111. [Crossref]
2. Bentzen SM, Buffa FM, Wilson GD (2008) Multiple Biomarker Tissue Microarrays: Bioinformatics and Practical Approaches. Cancer Metastasis Rev 27: 481-494. [Crossref]
3. Yan D, Wang P, Knudsen BS, Linden M, Randolph TW (2012) Statistical Methods for Tissue Array Images - Algorithmic Scoring and Co-training. Ann Appl Stat 6: 1280-1305. [Crossref]
4. Kumar A, Rao A, Bhavani S, Newberg JY, Murphy RF (2014) Automated Analysis of Immunohistochemistry Images Identifies Candidate Location Biomarkers for Cancers. Proc Natl Acad Sci U S A 111: 18249-18254. [Crossref]
5. Guirado R, Carceller H, Castillo Gómez E, Castrén E, Nacher J (2018) Automated Analysis of Images for Molecular Quantification in Immunohistochemistry. Heliyon 4: e00669. [Crossref]
6. Rojo MG, Bueno G, Slodkowska J (2009) Review of Imaging Solutions for Integrated Quantitative Immunohistochemistry in the Pathology Daily Practice. Folia Histochem Cytobiol 47: 349-354. [Crossref]
7. Ang KK, Harris J, Wheeler R, Weber R, Rosenthal DI et al. (2010) Human Papillomavirus and Survival of Patients With Oropharyngeal Cancer. N Engl J Med 363: 24-35. [Crossref]
8. Patel RR, Ludmir EB, Augustyn A, Zaorsky NG, Lehrer EJ et al. (2020) De-intensification of Therapy in Human Papillomavirus Associated Oropharyngeal Cancer: A Systematic Review of Prospective Trials. Oral Oncol 103: 104608. [Crossref]
9. Baschnagel AM, Williams L, Hanna A, Chen PY, Krauss DJ et al. (2014) c-Met Expression Is a Marker of Poor Prognosis in Patients With Locally Advanced Head and Neck Squamous Cell Carcinoma Treated With Chemoradiation. Int J Radiat Oncol Biol Phys 88: 701-707. [Crossref]
10. Baschnagel AM, Wobb JL, Dilworth JT, Williams L, Eskandari M et al. (2015) The Association of (18)F-FDG PET and Glucose Metabolism Biomarkers GLUT1 and HK2 in p16 Positive and Negative Head and Neck Squamous Cell Carcinomas. Radiother Oncol 117: 118-124. [Crossref]
11. Baschnagel AM, Tonlaar N, Eskandari M, Kumar T, Williams L et al. (2017) Combined CD44, c-MET, and EGFR Expression in p16-positive and p16-negative Head and Neck Squamous Cell Carcinomas. J Oral Pathol Med 46: 208-213. [Crossref]
12. Gillison ML, Trotti AM, Harris J, Eisbruch A, Harari PM et al. (2019) Radiotherapy Plus Cetuximab or Cisplatin in Human Papillomavirus-Positive Oropharyngeal Cancer (NRG Oncology RTOG 1016): A Randomised, Multicentre, Non-Inferiority Trial. Lancet 393: 40-50. [Crossref]
13. Wilson TG, Hanna A, Recknagel J, Pruetz BL, Baschnagel AM et al. (2019) Prognostic Significance of MTOR Expression in HPV Positive and Negative Head and Neck Cancers Treated by Chemoradiation. Head Neck 42: 153-162. [Crossref]
14. Gillison ML (2004) Human Papillomavirus-Associated Head and Neck Cancer Is a Distinct Epidemiologic, Clinical, and Molecular Entity. Semin Oncol 31: 744-754. [Crossref]
15. Gillison ML, D'Souza G, Westra W, Sugar E, Xiao W et al. (2008) Distinct Risk Factor Profiles for Human Papillomavirus Type 16-positive and Human Papillomavirus Type 16-negative Head and Neck Cancers. J Natl Cancer Inst 100: 407-420. [Crossref]
16. Vidal L, Gillison ML (2008) Human Papillomavirus in HNSCC: Recognition of a Distinct Disease Type. Hematol Oncol Clin North Am 22: 1125-1142. [Crossref]
17. Keck MK, Zuo Z, Khattri A, Stricker TP, Brown CD et al. (2015) Integrative Analysis of Head and Neck Cancer Identifies Two Biologically Distinct HPV and Three non-HPV Subtypes. Clin Cancer Res 21: 870-881. [Crossref]
18. Seiwert TY, Zuo Z, Keck MK, Khattri A, Pedamallu CS et al. (2015) Integrative and Comparative Genomic Analysis of HPV-positive and HPV-negative Head and Neck Squamous Cell Carcinomas. Clin Cancer Res 21: 632-641. [Crossref]
19. Agrawal N, Frederick MJ, Pickering CR, Bettegowda C, Changet K al. (2011) Exome Sequencing of Head and Neck Squamous Cell Carcinoma Reveals Inactivating Mutations in NOTCH1. Science 333: 1154-1157. [Crossref]
20. Stransky N, Egloff AM, Tward AD, Kostic AD, Cibulskis K et al. (2011) The Mutational Landscape of Head and Neck Squamous Cell Carcinoma. Science 333: 1157-1160. [Crossref]
21. Ljungkvist AS, Bussink J, Kaanders JH, van der Kogel AJ (2007) Dynamics of Tumor Hypoxia Measured With Bioreductive Hypoxic Cell Markers. Radiat Res 167: 127-145. [Crossref]
22. Linge A, Löck S, Gudziol V, Nowak A, Lohaus F et al. (2016) Low Cancer Stem Cell Marker Expression and Low Hypoxia Identify Good Prognosis Subgroups in HPV(-) HNSCC After Postoperative Radiochemotherapy: A Multicenter Study of the DKTK-ROG. Clin Cancer Res 22: 2639-2649. [Crossref]
23. Yang C, Zhang Y, Zhang Y, Zhang Z, Peng J et al. (2015) Downregulation of Cancer Stem Cell Properties via mTOR Signaling Pathway Inhibition by Rapamycin in Nasopharyngeal Carcinoma. Int J Oncol 47: 909-917. [Crossref]
24. Gadhoum SZ, Madhoun NY, Abuelela AF, Merzaban JS (2016) Anti-CD44 Antibodies Inhibit Both mTORC1 and mTORC2: A New Rationale Supporting CD44-induced AML Differentiation Therapy. Leukemia 30: 2397-2401. [Crossref]
25. Kim J, Jiang J, Badawi M, Schmittgen TD (2017) miR-221 Regulates CD44 in Hepatocellular Carcinoma Through the PI3K-AKT-mTOR Pathway. Biochem Biophys Res Commun 487: 709-715. [Crossref]
26. Badawi M, Kim J, Dauki A, Sutaria D, Motiwala T et al. (2018) CD44 Positive and Sorafenib Insensitive Hepatocellular Carcinomas Respond to the ATP-competitive mTOR Inhibitor INK128. Oncotarget 9: 26032-26045. [Crossref]
27. Li X, Zhou N, Wang J, Liu Z, Wang X et al. (2018) Quercetin suppresses breast cancer stem cells (CD44(+)/CD24(-)) by inhibiting the PI3K/Akt/mTOR-signaling pathway. Life Sci 196: 56-62. [Crossref]
28. Bai J, Chen WB, Zhang XY, Kang XN, Jin LJ et al. (2020) HIF-2α Regulates CD44 to Promote Cancer Stem Cell Activation in Triple-Negative Breast Cancer via PI3K/AKT/mTOR Signaling. World J Stem Cells 12: 87-99. [Crossref]
29. Keysar SB, Le PN, Miller B, Jackson BC, Eagleset JR al. (2017) Regulation of Head and Neck Squamous Cancer Stem Cells by PI3K and SOX2. J Natl Cancer Inst 109: djw189. [Crossref]
30. Chen J (2014) Significance of CD44 expression in head and neck cancer: a systemic review and meta-analysis. BMC Cancer 14: 15.
31. Chinn SB, Darr OA, Peters RD, Prince ME (2012) The Role of Head and Neck Squamous Cell Carcinoma Cancer Stem Cells in Tumorigenesis, Metastasis, and Treatment Failure. Front Endocrinol (Lausanne) 3: 90. [Crossref]
32. Joshua B, Kaplan MJ, Doweck I, Pai R, Weissman IL et al. (2012) Frequency of Cells Expressing CD44, a Head and Neck Cancer Stem Cell Marker: Correlation With Tumor Aggressiveness. Head Neck 34: 42-49. [Crossref]
33. Trapasso S, Allegra E (2012) Role of CD44 as a Marker of Cancer Stem Cells in Head and Neck Cancer. Biologics 6: 379-383. [Crossref]
34. Chinn SB, Darr OA, Owen JH, Bellile E, McHugh JB et al. (2015) Cancer Stem Cells: Mediators of Tumorigenesis and Metastasis in Head and Neck Squamous Cell Carcinoma. Head Neck 37: 317-326. [Crossref]
35. Thapa R, Wilson GD (2016) The Importance of CD44 as a Stem Cell Biomarker and Therapeutic Target in Cancer. Stem Cells Int 2016: 2087204. [Crossref]
36. Peitzsch C, Nathansen J, Schniewind SI, Schwarz F, Dubrovska A et al. (2019) Cancer Stem Cells in Head and Neck Squamous Cell Carcinoma: Identification, Characterization and Clinical Implications. Cancers (Basel)11: 616. [Crossref]
37. van Oordt CW, Gomez Roca C, van Herpen C, Coveler AL, Mahalingam D et al. (2016) First-in-human Phase I Clinical Trial of RG7356, an anti-CD44 Humanized Antibody, in Patients With Advanced, CD44-expressing Solid Tumors. Oncotarget 7: 80046-80058. [Crossref]
38. Thapa R (2015) Radiosensitizing and hyperthermic properties of hyaluronan conjugated, dextran-coated ferric oxide nanoparticles: implications for cancer stem cell therapy. J NanomateriaL 16: 400.
39. Thapa R (2016) Hyaluronan-mediated ferric oxide nanoparticles causes apoptosis of CD44 expressing head and neck squamous cell carcinoma cells. Int J Cancer Ther Oncol 4: 424.
40. Su Z, Liu D, Chen L, Zhang J, Ru L et al. (2019) CD44-Targeted Magnetic Nanoparticles Kill Head And Neck Squamous Cell Carcinoma Stem Cells In An Alternating Magnetic Field. Int J Nanomedicine 14: 7549-7560. [Crossref]
41. Fander J, Kielstein H, Büttner M, Koelblinger P, Dummer R et al. (2019) Characterizing CD44 Regulatory microRNAs as Putative Therapeutic Agents in Human Melanoma. Oncotarget 10: 6509-6525. [Crossref]
42. Kim BW, Cho H, Chung JY, Conway C, Ylaya K et al. (2013) Prognostic Assessment of Hypoxia and Metabolic Markers in Cervical Cancer Using Automated Digital Image Analysis of Immunohistochemistry. J Transl Med 11: 185. [Crossref]