Cardiac Energy
A B S T R A C T
Introduction/Objectives: In the cardiac cycle, should a coupling phase be considered between systole and diastole where cardiac suction occurs? Shouldn't the left ventricular ejection fraction be considered a poor reliability index? According to these considerations, would it not be more logical to speak of cardiac energy of suction and ejection as parameters that summarize the cardiac potential and to which variables that are not independent would concur.
Materials and Methods: The concept of energy is incorporated by means of a detailed evaluation of the cardiac ability developed by both ventricles as a counterpart of ejection fraction values to assess ventricular function. The heart in its pump function, presents a dynamic effect that is greater than the volume it ejects. Data involving patients will have informed consent.
Results: Understanding the active mechanism of the suction phase as a link between systole and diastole opens a wide scenario on surgical techniques and medical treatments for many cardiac diseases that are still the focus of attention.
Conclusion: The important incorporation of other disciplines such as physics and hydraulics has allowed the evaluation of cardiac mechanics from pre-existing laws that denote and justify what the heart really represents: a mechanical suction pump. The understanding of cardiac functions is achieved from the cardiac structure-function and from a physico/hydraulic point of view.
Keywords
Heart, energy, suction, hydraulic, congestion
Introduction
Cardiac energy is the capacity of the heart to generate work. The energy produced by the heart, in Joules or Ws, is the energy provided by the heart per unit time and the volume produced is the volume of blood ejected per unit time. There is no integral description of circulatory system dynamics linking the heart with the vascular system. The only expression used, associating the heart with the vascular system is:
(a) Blood pressure = cardiac output × systemic vascular resistance
In addition, blood pressure used in equation (a) denotes the pressure difference between both ends of the vascular system (pressure difference between arterial pressure and venous pressure), which is not equal to arterial pressure. In fact, venous pressure, lower than arterial pressure, does not normally enter in question, but it does in conditions of heart failure, where it becomes relevant. However, it is not possible to discuss absolute values of arterial pressure or changes in venous pressure using equation (a). Thus, equation (a) is a property of the vascular system while the term stroke volume refers to the capacity of the heart.
Blood flow is the output volume divided by the time it takes to eject it. The law of Poiseuille, which will be studied below, expresses that pressure is the product of cardiac output by systemic vascular resistance. It becomes equation (a) if it is applied during a time in which flow can be considered stable. To guarantee flow stability, it is not possible to apply the law of Poiseuille when the circulatory phenomenon lasts a beat or less, a longer measurement exceeding one minute, being necessary for its practical implementation.
It is correct that arterial pressure is determined by the property of the vascular system, but not the notion that stroke volume is equal to heart capacity. Although the right ventricle (RV) and the left ventricle (LV) eject the same blood volume, they have different energies. Cardiac output is not an independent value. It depends on energy and systemic vascular resistance. This invalidates equation (a).
If the aorta is occluded, cardiac output falls, that is, volume changes according to resistance; therefore, cardiac output is not an independent value, but is a function of two independent variables: output energy and systemic vascular resistance. Thus, equation (a) makes the concept of an integral circulatory system dynamics invalid. Systolic left ventricular ejection fraction (LVEF) is the usual parameter used in clinical practice to assess ventricular function and classify the different stages of heart failure. This parameter carries the classical concept of considering systole as a movement with active energy expenditure, and diastole as only a passive filling phase.
Left ventricular ejection fraction has its limitations, since it is a variable dependent on numerous factors (preload, afterload) that hamper the expression of the real ventricular capacity, as evidenced in the follow-up of patients that do not show a linear correlation between functional class and ejection fraction. According to these considerations it would be more logical to speak of ejective cardiac energy as a parameter that summarizes cardiac power, and which will encompass non-independent variables. Recent investigations have demonstrated an active diastolic isovolumic phase with a suction effect, called Active Protodiastolic Suction Phase (APDSP), during which an abrupt drop in left ventricular pressure is produced [1]. Therefore, it would be logical to consider a three-stage cardiac cycle: systole, suction, and diastole. In this model, energy expenditure is prolonged from systole to the suction period, while only during the diastolic relaxation phase there is no energy consumption. This concept is essential to consider the suction cardiac energy generated during the APDSP. This phase may become a promising clinical indicator, as left ventricular suction energy is the continuity link between the pulmonary and systemic circulations. In the process of investigating cardiac energy, suction energy and ejective energy should be established as more reliable ventricular function parameters.
In the circulatory cycle, there is only one period that attains negative pressure, absolute or relative, in some chambers at a defined moment. This phenomenon is only produced during the 100 ms of APDSP in which there is a notable drop in pressure, according to our measurements in patients undergoing a resynchronization procedure (Figure 1) [2]. This phase is active and isovolumic. Between aortic valve closure and mitral valve opening, there is an abrupt drop of intraventricular pressure with energy expenditure until reaching negative values (Figure 2). It is during this phase that muscle contraction of the ascending segment end in its insertion into the cardiac fulcrum elicits LV lengthening-detorsion with the closed chamber [3]. This was corroborated in our investigations in patients using three-dimensional electroanatomical mapping with Carto navigation and mapping system (Figure 3) [4, 5].
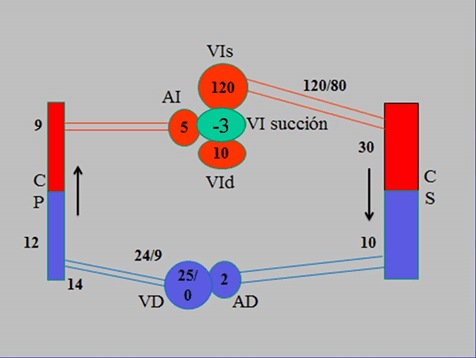
Figure 1: Diagram of the circulatory system with pressure values throughout its course. Pressures are expressed in mmHg. References: LVs: Left Ventricle in Systole; LA: left atrium; LVd: Left Ventricle in Diastole; PC: Pulmonary Capillary; RV: Right Ventricle; RA: Right Atrium; SC: Systemic Capillary.

Figure 2: Left intraventricular pressure in patient. The red circle shows the drop in intraventricular pressure.
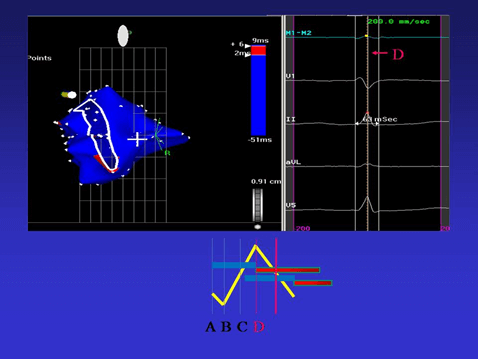
Figure 3: The endocardial activation ends in the area corresponding to the mitral annulus. Note that all the endocardial activation “occupies” approximately 60% of QRS duration (D line in the right panel). Epicardial activation has started earlier, but its completion occurs during the final part of the QRS.
A fluid moves along a tube in response to a pressure gradient. When all the blood is perfused in the vascular system, the pressure gradient must be greater than 10 mmHg to generate flow. The pressure difference between the pulmonary capillaries and the left atrium is 4-6 mmHg. Then, does a low-pressure gradient force the passage through the pulmonary circuit of the same amount of blood ejected along the general circuit that has a pressure gradient of 90 mmHg? In addition, left atrial power is only 1/100 that of the ventricle, so no marked pump function effects can be expected from it.
The systemic and pulmonary vascular beds are connected in series to form a continuous circuit. We must speak of RV-pulmonary circulation and LV-systemic circulation as a single circulatory pathway, in which the pressure differences and the vascular resistances determine the continuous blood circulation. The ventricular chambers and vascular circuits are two different systems with a characteristic hemodynamic behaviour, whose end is to maintain circulatory flow. This concept leads to consider suction during APDSP as an essential element in the circulatory system physiology, by being the continuity link between the pulmonary and systemic circulations.
Considerations on the Energy Concept
Energy is the capacity to produce work. If force is applied on a fluid, such as blood, and acts on a surface such as that of a valve or the transverse section of an artery or vein, pressure is developed on that surface. Under these premises, the integral equation to calculate energy, well used in thermodynamics and fluid mechanics, can be applied.
\[E=\int_{V_1}^{V_2}{P.dV}\]
E: Energy; P: Pressure; V: Volume
In gases, there is an inverse relationship between pressure and volume at constant temperature, controlled by Boyle’s Law, but blood is a non-Newtonian fluid in which regardless of how much pressure is varied, volume does not change, because it is incompressible. Therefore, pressure is independent of volume and the equation then becomes:
\[E=P.V\]
E: Energy in mmHg.ml; P: Pressure in millimeters of mercury (mmHg); V: Volume: in milliliters(ml)
In a system of ducts through which a viscous fluid circulates, as the circulatory system, energy losses are produced due to friction of the fluid particles among them and with the vessel walls, due to their viscosity: This phenomenon, known as power loss, is not constant along the circuit since it depends on the local circuit diameter and the local velocities of the circulating fluid.
This power loss is a pressure loss along the circuit, which translates into an added resistance to free fluid circulation. When adding power loss, the previous equation is rewritten as:
\[E=\left(P+P_C\right)\ .V\]
E: Energy; P: Hydraulic pressure; Pc: Power loss due to friction; V: Volume
This equation is valid for rigid ducts, but in the case of the circulatory system, the possible generation of pulsatile pressures, which may help or affect circulation, should be considered. Therefore, the equation must be written as:
\[E=\left(P+P_C+P_P\right).V\]
At this point, it is convenient to analyse the terms of this equation to understand its physical meaning; thus
i. E is the energy that each ventricle transfers to the blood during its function, either by ejection or suction.
ii. V is the blood volume ejected or drawn out.
iii. P is the hydraulic pressure the fluid has at the point of measurement.
iv. Pc is the power loss or pressure loss in the circuit due to friction. This is the energy that is not transformed into motion, but dissipates due to friction, as heat or work.
v. Pp is the change of pressure by the circuit elements’ impulse or deformation. This impulse or deformation can be active, PPA, if the circuit in its impulse introduces energy to the fluid, or passive, PPP, if circuit deformation is caused by the fluid with energy consumption and pressure loss. The PPA component is normally zero in all engineering duct systems, but not in the circulatory system in which in certain circumstances the action of muscles, different from the cardiac one, can provide energy to the circulatory system. We then consider the new formula:
\[E=\left(P+P_C+P_{PP}\right)\ .\ \ V-P_{PA}\ .V\]
vi. The resistant pressure, that opposes to fluid flow is PR = PC +PPP. This pressure always appears in circuits where a viscous fluid flows and in the circulatory system it is the pressure associated with vascular resistance. The previous equation can then be rewritten as:
\[E=\left(P+P_R\right)\ .\ \ V-P_{PA\ }.V\]
Consequently, the ejected or drawn volume will be:
\[V=\frac{E}{P+P_R-P_{PA}}\]
Calculations of Cardiac Energy
Cardiac energy is equivalent to the work generated by the ejective or suction function according to the phase analysed, while cardiac stroke volume means the output of a certain heart volume. Poiseuille’s law establishes a relationship between flow or blood flow and the pressure gradient:
\[Q=\frac{V}{t}=\frac{∆Pπr^4}{8\mu l}\]
Q: Flow; V: Volume; t: time; DP: Pressure gradient or change; r: Artery or vein radius; m: Dynamic blood viscosity; l: Circuit length.
It can be deduced that in a certain section of the circuit and at given time, a pressure change is produced, as:
\[∆P=V . \frac{8μl}{πr^4}=V . H\]
To know the total pressure gradient in the circulatory system, it would be necessary to consider the complete geometry of the system and divide it in several sections, each with its radius and length, in addition to contemplating its branches. Once this is accomplished, if all the pressure gradients for all the sections are added, the total pressure loss will be obtained, and if the H coefficient is added for all the sections, systemic vascular resistance will be obtained, resulting in:
\[P=V\ .\ \ R\]
P: Pressure; V: Volume; R: Systemic vascular resistance
Systemic vascular resistance thus expressed, although it is called resistance, is neither a force nor a pressure, but has pressure units divided by volume, or force divided by the fifth power of length.
As previously seen, the ejected volume is determined by energy production and vascular resistance, either systemic or pulmonary. Systemic vascular resistance has just been defined as a property of the vascular system which depends on its geometry and blood characteristics, while volume refers to the heart capacity. Undoubtedly, the concept that arterial pressure is determined by the properties of the vascular system and the heart capacity is correct, but the concept that ejective volume is a synonym for heart capacity is erroneous.
In fact, left ventricular stroke volume is always approximately equal to that of the RV, but the LV and the RV do not have the same capacity. The capacity of a ventricle must be evaluated not so much by stroke volume but by its energy production. In other words, stroke volume is not an independent variable reflecting only the capacity of the heart but is a function of two independent variables: energy production and systemic vascular resistance.
We will henceforth use the previous equation as pressure equation, but this expression is a simplification expressing proportionality, and does not allow to continue solving the equations, as it is known that resistance is a dynamic phenomenon which in turn depends on volume and pressure; therefore, it would be more correct to write:
\[P=V\ .\ \ R\ \left(V\ .\ P\right)\]
The phenomenon is transient, and the previous formula is only valid when the circulatory phenomenon is considered within a certain time span, for example a minute, and with uniform performance. On the other hand, the integral capacity of the LV should be evaluated not by stroke volume, but by the energy analysed in the previous section:
\[E=P\ .\ \ V\]
E: Energy in mmHg.mL
In addition, stroke volume is not an independent variable, as it depends on energy and resistance, according to a certain a priori nonlinear function
\[V=f\ \left(E\ .\ \ \frac{1}{R}\right)\]
Therefore, LVEF cannot be simply assessed as a percentage of left ventricular stroke volume, because it depends on two variables: energy and vascular resistance.
\[EF\neq\frac{SV}{EDV}\]
SV: Stroke volume; EDV: End diastolic volume
When a calculation based on energy is used (integrated variables) in a ventricular chamber, it results more evident than simply expressing function in terms of a pressure variable. The blood pressure concept is determined by the properties of the vascular system and the heart capacity. Although this is correct, the notion that stroke volume is equivalent to heart function capacity is apparent. For example, the RV and the LV eject similar volumes, but their energies are different; hypothetically, if aortic diameter is reduced, stroke volume falls. This implies that volume changes according to the resistance, and that hence, the stroke volume is not an independent value.
Blood circulation is a dynamic state which, at the level of the cardiac pump, continuously modifies its functional properties in an interchangeable adaptation with the vascular system and its resistances. At the heart level, those derived from its stroke volume have been used as performance parameters. According to these considerations it would be more logical to speak of ejective energy as a parameter that encompasses the integral cardiac performance in that period, to which suction energy should be added, if we consider that this phenomenon is due to active myocardial contraction, as demonstrated throughout this investigation with anatomical studies, electroanatomical mappings and imaging studies (echocardiography, and magnetic resonance imaging [6-13]. This contraction takes place in the protodiastolic period and represents the complementary link of the circulation between both ventricles. Thus, there is no drastic change between systole and diastole, but a transition phase called APDSP, with lower energy for ejection, but necessary to produce cardiac filling.
Congestion
Left ventricular output volume becomes the return volume of the vena cava and the stroke volume of the RV. Pulmonary vein congestion does not occur by a difference in volume production between the LV and the RV. Why does congestion occur if the stroke volume is the same as the return volume? How can left ventricular and right ventricular failure be defined? What is the role of a drop in energy production? When energy production is reduced in any of the two ventricles, blood volume in the arterial side decreases and that in the RV increases, leading to congestion.
In essence, the greater the blood volume, the higher the energy production required to solve congestion (i. e. approach venous pressure to zero). Let us recall that blood volume in the pulmonary veins is 1/10 that in the systemic veins. In fact, to analyse the balance between both circulatory systems, there must be a volume equilibrium, and according to the previous equation the energy-resistance relationship f (E, 1/R) should be compared. Then, if energy production decreases unilaterally, venous pressure increases (preload) and produces ischemia in the arterial side (afterload). Heart failure develops due to the imbalance in the relationship between energy production and resistance.
\[f\left(E\ ,\ \ \frac{1}{R}\right)\]
Heartbeats have a heterogeneous volume. There is an imbalance between output and input blood in each beat. These slight differences are absorbed by the cardiac residual volume. This situation compensates while the heart has the adequate ejection and suction energy capacity.
Central venous pressure is analogous to pulmonary capillary pressure, which is ultimately the load that the venous system delivers to the LV. Why is there a left ventricular suction property?
i. Blood must return to the heart avoiding two resistances (systemic and pulmonary).
ii. The small difference between peripheral and heart pressure does not explain this circuit [14, 15].
iii. The RV inserted into the venous circuit is an accessory ejective chamber.
iv. The atria are volume compensatory chambers which prevent ventricular overload. They absorb with their distorted walls, the abrupt thuds produced by valve closure.
v. Transmitral flow is consequence and not cause. It is produced as a result of the negative pressure generated during myocardial contraction for the first 100 ms of diastole, which we have termed APDSP, allowing valve opening.
vi. The left and the right ventricular volumes are equal, but they do not have the same energy. Here is a coherent point to understand the left ventricular suction energy necessary for cardiac filling.
vii. When the RV is excluded, the systemic venous system which would normally be a low-pressure system, is now an almost high-pressure system, and the amount of blood stored can change to a great extent, even in response to a slight pressure difference. Congenital heart disease surgeries excluding the RV are evident confirmations of the left ventricular suction power [16-18].
viii. Given these reasonings we should consider an additional force for left ventricular filling; therefore, left ventricular load is solved with an energy complement between right ventricular ejection and left ventricular suction.
ix. There is asynchrony between the RV and the LV. In our investigations, the former contracts 12.4 ms before the left one [3]. This facilitates left ventricular suction after the end of right ventricular ejection, as the heart does not contract en bloc but in fractions of a continuous structural unit. After left ventricular systole, left ventricular active suction complements the RV which ends its contraction before the LV.
x. The ascending segment activation which occurs 25.8 ms after the descending segment implies a delayed depolarization of the latter, allowing it to remain active after aortic valve closure during the first 100 ms of diastole.
xi. If ventricular systole lasts around 300 ms, the remaining 100 ms of myocardial contraction corresponds to the APDSP. In synthesis, during this phase, the myocardial ascending segment remains contracted as a consequence of the depolarization that took place during the course of the QRS.
Blood flow from the capillary system to the left atrium is not an independent phenomenon of diastolic ventricular filling. If we consider that there is a continuum during the systolic-diastolic cycle, we can then understand that protodiastolic ventricular suction is an important mechanism to complete pulmonary capillary circulation to the LV, and hence, is an essential mechanism to maintain the continuity between the two circulations, minor and major. Venous pressure is similar in both circulations; therefore, left ventricular suction plays a fundamental role to maintain circulation. Impaired left ventricular suction energy may give rise to heart failure with pulmonary congestion and normal ejection fraction, as this is a fraction of the final diastolic volume. Thus, LVEF does not reflect the true state of cardiac capacity.
The suction phenomenon, provided it is intact, helps the return of blood ejected by the LV. When congestion occurs in the pulmonary circulation it is due to left ventricular suction deficit and/or as a consequence of systolic ejection deficit. Consequently, there is imbalance between Volume (V) and Energy (E).
a) If energy is not enough to move blood volume, there is congestion.
b) If energy is enough to move blood volume, there is no congestion.
Hence, more energy is required to solve congestion.
When a heart produces adequate suction, arterial pressure increases and venous pressure decreases, therefore, relieving congestion. Left ventricular suction improves right ventricular filling. If suction is normal and ejection is low, residual volume increases, lowering the capacity of subsequent suction; i.e., it leads to congestion. It is not logical to speak only of ejective failure as the only deficit of heart failure. Therefore, the term diastolic heart failure, erroneously called heart failure with preserved function, occurs because the left ventricular function always has some degree of impairment [19].
The energy of the two ventricles, the resistance of both the pulmonary and systemic systems and the aortic and pulmonary pressures are proportional in a 6:1 ratio, which means that the RV is proportional to 15% of the LV. How can the RV with less energy have the same output as the LV? An energetic complement is added to the difference in resistance between the systemic and pulmonary circulation, which drives flow during the APDSP in the 100 ms immediately after systole. Therefore, in the LV, we should speak of output energy (ejection) and input energy (suction). The isolated LVEF does not solve the prognostic or diagnostic cardiac problem. It is a partial aspect which depends on other factors, as already analysed. On the other hand, is it not impaired left ventricular suction the cause of diastolic heart failure? The phenomenon of heart failure with preserved LVEF is perfectly understood due to the impaired left ventricular suction mechanism. The consequence of this inability to generate an adequate timely negative pressure would determine a slower myocardial detorsion.
Acknowledgement
Not applicable.
Conflicts of Interest
None.
Funding
None.
Informed Consent
The authors give their informed consent for publication.
Author Contributions
Trainini Jorge: Coordination; Valle Cabezas Jesús: Calculations; Carreras Costa Francesc: Calculations; Beraudo Mario: Background; Wernicke Mario: Background; Trainini Alejandro: Drafting; Mora Llabata Vicente: Clinic; Lowenstein Haber Diego: Drafting; Bastarrica María Elena: Clinic; Lowenstein Jorge: Calculations.
Article Info
Article Type
Research ArticlePublication history
Received: Thu 01, Sep 2022Accepted: Wed 21, Sep 2022
Published: Tue 04, Oct 2022
Copyright
© 2023 Jorge Carlos Trainini. This is an open-access article distributed under the terms of the Creative Commons Attribution License, which permits unrestricted use, distribution, and reproduction in any medium, provided the original author and source are credited. Hosting by Science Repository.DOI: 10.31487/j.CEI.2022.01.02
Figures & Tables
References
1. Trainini JC, Lowenstein J, Beraudo
M, Trainini A, Mora Llabata V et al. (2019) Myocardial Torsion. Ed Biblos,
Buenos Aires; Argentina.
2. Elencwajg B, López Cabanillas N,
Cardinali EL, Barisani JL, Trainini J et al. (2012) The Jurdham procedure
endocardial left ventricular lead insertion via a femoral transseptal sheath
for cardiac resynchronization therapy pectoral device implantation. Heart
Rhythm 9: 1798-1804. [Crossref]
3. Trainini JC, Lowenstein J, Beraudo
M, Wernicke M, Trainini A et al. (2021) Myocardial torsion and cardiac fulcrum. Morphologie 105: 15-23. [Crossref]
4. Trainini JC, Elencwajg B, López
Cabanillas N, Herreros J, Lago N (2015) Electrophysiological Bases of Torsión
and Suction in the Continuous Cardiac Band Model. Anat Physiol 5:
S4-001.
5.
Trainini
JC, Elencwajg B, López Cabanillas N, Herreros J, Lowenstein J et al. (2017) Ventricular torsion and cardiac
suction effect: The electrophysiological analysis of the cardiac band muscle. Interventional
Cardiol 9: 45-51.
6. Ballester M, Ferreira A, Carreras F
(2008) The myocardial band. Heart Fail Clin 4: 261-272. [Crossref]
7. Biesiadecki B, Davis J, Ziolo M,
Janssen P (2014) Tri-modal regulation of cardiac muscle relaxation;
intracellular calcium decline, thin filament deactivation, and cross-bridge
cycling kinetics. Biophys Rev 6: 273-289. [Crossref]
8.
Carreras F,
Ballester M, Pujadas S, Leta R, Pons Lladó G (2006) Morphological and
functional evidences of the helical heart from non-invasive cardiac imaging. Eur J Cardiothoracic Surg 29: S50-S55. [Crossref]
9.
Cosín Aguilar J, Hernándiz Martínez A, Tuzón
Segarra MT, Agüero Ramón Llin J, Torrent Guasp F (2009) Estudio experimental de
la llamada fase de relajación isovolumétrica del ventrículo izquierdo. Rev Esp Cardiol 62: 392-399.
10.
Mora V, Roldán I, Romero E, Saurí A,
Romero D (2018) Myocardial contraction during the diastolic isovolumetric
period: analysis of longitudinal strain by means of speckle tracking
echocardiography. J Cardiovasc Dev Dis 5: 41. [Crossref]
11. Poveda F, Gil
D, Martí E, Andaluz A, Ballester M et al. (2013) Estudio tractográfico de la
anatomía helicoidal del miocardio ventricular mediante resonancia magnética por
tensor de difusión. Rev Esp
Cardiol 66:
782-90.
12. Seetharam K, Lerakis S (2019)
Cardiac magnetic resonance imaging: the future is bright. F1000Res 8:
F1000. [Crossref]
13. Sengupta P, Khandheria B, Korinek
J, Wang J, Jahangir A et al. (2006) Apex-to-Base Dispersion in Regional Timing
of Left Ventricular Shortening and Lengthening. J Am Coll Cardiol 47:
163-172. [Crossref]
14. Buckberg GD, Coghlan HC, Torrent
Guasp F (2001) The structure and function of the helical heart and its buttress
wrapping. V. Anatomic and physiologic considerations in the healthy and failing
heart. Sem Thorac Cardiovasc Surg 13: 358-385. [Crossref]
15. Hayabuchi Y, Sakata M, Kagami S
(2015) Assessment of the helical ventricular myocardial band using standard
echocardiography. Echocardiography 32: 310-318. [Crossref]
16. Robinson TF, Factor SWM,
Sonnenblick EH (1986) The heart as a suction pump. Sci Am 254: 84-91. [Crossref]
17. Trainini JC, Trainini A, Valle
Cabezas J, Cabo J (2019) Left
Ventricular Suction in Right Ventricular Dysfunction. EC Cardiology 6:
572-577.
18. Tyberg JV, Keon WJ, Sonnenblick EH, Urschel J (1970) Mechanics of ventricular disease. Cardiovasc Res 4: 423-428.
19. Lazar Mandinov L, Eberli F, Seiler C, Hess OM (2000) Diastolic heart failure. Cardiovasc Res 45: 813-825. [Crossref]