Comprehensive Expression and Prognosis Analyses of ITGB1 in AML
A B S T R A C T
Background: Acute myeloid leukemia (AML) is a dangerous type of leukemia. The emergence of multidrug resistance (MDR) and recurrence limits the prognosis and survival of patients. In recent studies, we have known that the bone marrow microenvironment was closely related to the poor prognosis of AML. However, the underlying mechanisms are still far from fully understood. By utilizing the bioinformatics analysis, we screened out integrin β1 (ITGB1) as the hub gene, which is associated with the bone marrow microenvironment mediated changes of AML cells, with expression profile GSE73157 downloaded from the National Center for Biotechnology Information-Gene Expression Omnibus (NCBI-GEO) database.
Methods: R studio software was used to screen out candidate hub genes and further visualize the differential expression. R package ‘limma’ was to find out differentially expressed genes (DEGs). Gene Ontology (GO) enrichment and Kyoto Encyclopedia of Genes and Genomes (KEGG) pathway were conducted by R package “clusterProfiler”. Furthermore, the protein-protein interaction (PPI) network was also performed by the online tool STRING and software Cytoscape. Last but not least, online tools PrognoScan and GEPIA were utilized for the evaluation of the clinical significance of the selected hub gene. P and Cox p-value <0.05 was considered to be statistically significant.
Results: ITGB1 was filtrated as the only hub gene in this profile. We found that patients with high expression of ITGB1 had significantly longer overall survival (OS) than those with low expression (COX p-value= 0.016730). Besides, the expression of the ITGB1 gene in AML patients is lower than that in normal people significantly (p-value<0.01).
Conclusion: We identified ITGB1 as a key gene in the bone marrow microenvironment mediated poor prognosis in AML. The down-regulated expression of ITGB1 was related to AML patients’ poor outcomes. ITGB1 may be a potential marker for predicting and guiding AML treatment.
Keywords
Acute myeloid leukemia, the bone marrow microenvironment, bioinformatics analysis
Background
Leukemia is a malignant clonal disease of the hematopoietic system, which accounts for 4% of all cancers [1]. Among them, acute myeloid leukemia (AML) is a common and dangerous type of leukemia. Currently, chemotherapy is still the most important option for the treatment of AML. However, the emergence of multidrug resistance (MDR) and recurrence greatly limits the effects of chemotherapy drugs. Therefore, the research on MDR of AML cells has always been a research hotspot in hematology. In recent years, studies have found that the bone marrow microenvironment not only plays an important role in the hematopoietic process but is closely related to the occurrence and development of tumors. The bone marrow microenvironment contains multiple cell types, such as osteoblasts, mesenchymal stem cells, endothelial cells, neurons and so on. In normal humans, the bone marrow microenvironment affects hematopoietic stem cells mostly through the regulation of blood oxygen partial pressure and the secretion of cytokines [2]. However, in cancer patients, the occurrence of MDR and recurrence is inseparable from the role of the bone marrow microenvironment.
Leukemia and leukemia stem cells (LSCs) interact with the bone marrow microenvironment in a different way from hematopoietic stem cells to affect the development of leukemia [3]. LSCs can hide in the bone marrow niche to escape the killing effect of chemotherapy. As a result, the bone marrow niche has also become a key part of the recurrence and MDR of leukemia [4-6]. According to recent research, we have known that MDR mediated by the bone marrow microenvironment might stem from the following several mechanisms: i) The influence of cytokines; ii) Changes in adhesion of leukemia cells; iii) The regulation of expression of MDR-related genes; iv) The adjustment of cell cycle and metabolism [7-12]. In addition, many factors can also be contributed to the recurrence of leukemia, such as the secretion of cytokines or the changes with certain pathways.
With the emergence and rapid development of high-throughput platforms and microarray, numerous molecular heterogeneities on AML have been acknowledged. In order to find potential key biomarker of AML related to the bone marrow microenvironment mediated poor prognosis, through the use of biological information technology and the analysis of high-throughput sequencing chip data, we screened out the differentially expressed genes (DEGs) of AML cells cultured alone and co-cultured with stromal cells, which were all treated with different concentrations of Arsenic trioxide (ATO). Furthermore, we pick up ITGB1 as a hub gene that can be considered as the predictor of prognosis. We systematically reveal the occurrence and development of AML at the level of the molecule and provide potential guidance for targeted therapy.
Materials and Methods
I Analysis and Screening of Differentially Expressed Genes (DEGs)
The GEO database (Link 1) of the National Center for Biotechnology Information was used to select and download the gene express profile GSE73157 [13]. This profile was generated on the platform GPL17077 (Agilent-039494 SurePrint G3 Human GE v2 8*60K Microarray 039381). In order to reduce false-positive results, the online analysis tool GEO2R in the GEO database was used to process the data profile. The screen criteria were adjusted p-value < 0.05 and the use of Benjamini-Hochberg. Then, the R package ‘limma’ was used to differentiate the DEGs between NB4 cultured alone and co-cultured with stromal cells after the treatment of ATO. The screen criteria were adjusted p-value < 0.05 and [log2FoldChange (log2FC)] > 1 [14]. All genes were visualized by volcanic maps and the top 50 dramatically differentially expressed genes were selected to draw a heatmap by R package ‘ggplot2’ [15].
II Functional Enrichment Analysis and Pathway Analysis of DEGs
The R package ‘clusterProfiler’ was used to conduct Gene Ontology (GO) enrichment analysis and Kyoto Encyclopedia of Genes and Genomes (KEGG) pathway analysis in order to perform functional enrichment and pathway analysis of DEGs [16]. Biological process (BP), molecular function (MF) and cellular component (CC) are included in GO enrichment. Analysis results were illustrated as figures by R package ‘GOplot’ [17]. A p-value less than 0.05 was considered statistically significant. Also, the ClueGo plug-ins of Cytoscape software 3.8.1 were utilized to display the relationship between pathways [18]. A p-value less than 0.05 was considered statistically significant.
III Screening Candidate Genes Through Protein-Protein Interaction (PPI) Network
The PPI prediction website STRING (Link 2) constructed a protein interaction network [19]. And Cytoscape software 3.8.0 was used to visualize the interactions of DEGs [18]. Further, we used ‘cytoHubba’ to degree the interaction of hub-gene clustering by the method of Maxima Clique Centrality (MCC). Overlapped genes were separated by online toll Bioinformatics & Evolutionary Genomics (Link 3) and were displayed by Wayne diagram.
IV Selecting Candidate Genes and Conducting Survival Analysis
In order to evaluate the prognostic value of candidate genes in AML patients, we utilized the PrognoScan database (Link 4) and online tool Gene Expression Profiling Interaction Analysis (Link 5) to conduct the survival analysis [20, 21]. The results are displayed with a hazard ratio (HR) and Cox p-value from a Log-rank test. Cox p-value <0.05 was considered statistically significant. Besides, according to the online tool Gene Expression Profiling Interaction Analysis (GEPIA), we compared the expression of candidate genes in AML patients and normal people. The screen criteria were adjusted p-value < 0.01 and [log2FoldChange (log2FC)] > 1.
Results
I Analysis and Screening of Differentially Expressed Genes (DEGs)
The goal of this study is to screen out the hub gene of AML related to the bone marrow microenvironment mediated MDR (Figure 1). Performing statistical analysis on the GEO database, we found that the data set GSE73157contains 32080 DEGs in AML cultured alone groups and co-cultured groups (All the following are referred to as alone groups and co-culture groups, respectively). By using the R package ‘limma’, DEGs were classified as up-regulated genes (marked as red plots) and down-regulated genes (marked as green plots) (Figure 2a). Besides, a heatmap illustrated the top 50 DEGs (Figure 2b).
II Functional Enrichment Analysis and Pathway Analysis of DEGs
Go and KEGG enrichment analysis was performed on all DEGs with R package ‘clusterProfiler’. The results of GO include three subontologies referred to as biological process (BP), cellular components (CC), molecular function (MF). The GO results show that the angiogenesis pathway, cell adhesion molecule binding pathway and collagen-containing extracellular matrix pathway were selected as the most significant pathway in each subontologies, respectively (Figures 3a-3c). And we chose the angiogenesis pathway as our further analysis pathway as a result of the comparation of p-values. 177 genes were found enriched in this GO term. In addition, the PI3K-Akt signaling pathway was the top enriched pathway of the DEGs in KEGG enrichment analysis (Figure 3d). After we used the ClueGo to further analyse the interrelation of the enriched pathways and the DEGs, the PI3K-Akt signaling pathway was still the most significant pathway and involved 120 DEGs (Figures 3e & 3f). Finally, we selected two pathways for our further research, which involved 177 and 120 DEGs, respectively (Table 1). Then, after taking the intersection of the DEGs included in the two pathways, we could find that there are 26 genes included both in the two pathways (Figure 3g). They were PDGFRB, FLT1, NGFR, EFNA1, FGFR1, ITGB1, VEGFC, BRCA1, PDGFRA, PGF, EPHA2, EFNA3, PIK3CG, SYK, EREG, PTK2, ITGB8, FGF2, THBS1, FGF18, THBS2, AKT3, IL6, ANGPT1, FN1, ANGPT2.
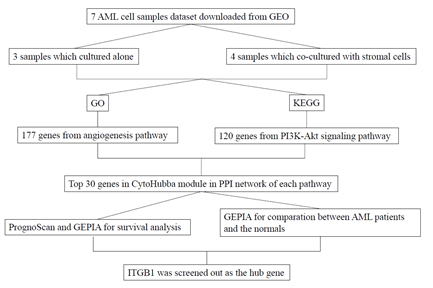
Figure 1: A schematic view of the procedure of the study with GSE73157.
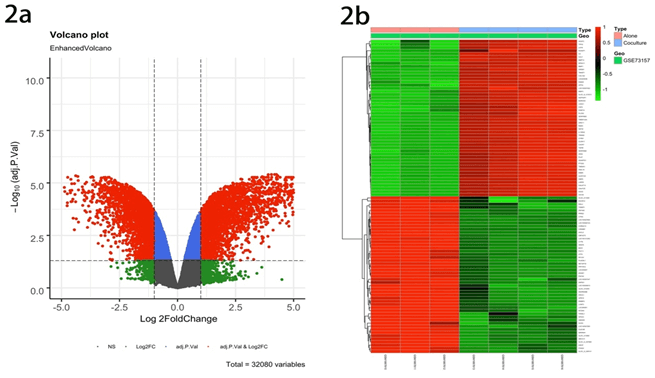
Figure 2: Identification of differentially expressed genes in the GSE73157 dataset. a) Volcano plot of GSE73157 dataset. Red plots represent up-regulated genes, and the green plots represent down-regulated ones with adjusted p-value < 0.05 and [log2FoldChange (log2FC)] > 1. Other plots represent the remaining genes with no significant difference. b) Heatmap of the top 50 DEGs (50 up- and 50 down-regulated genes).
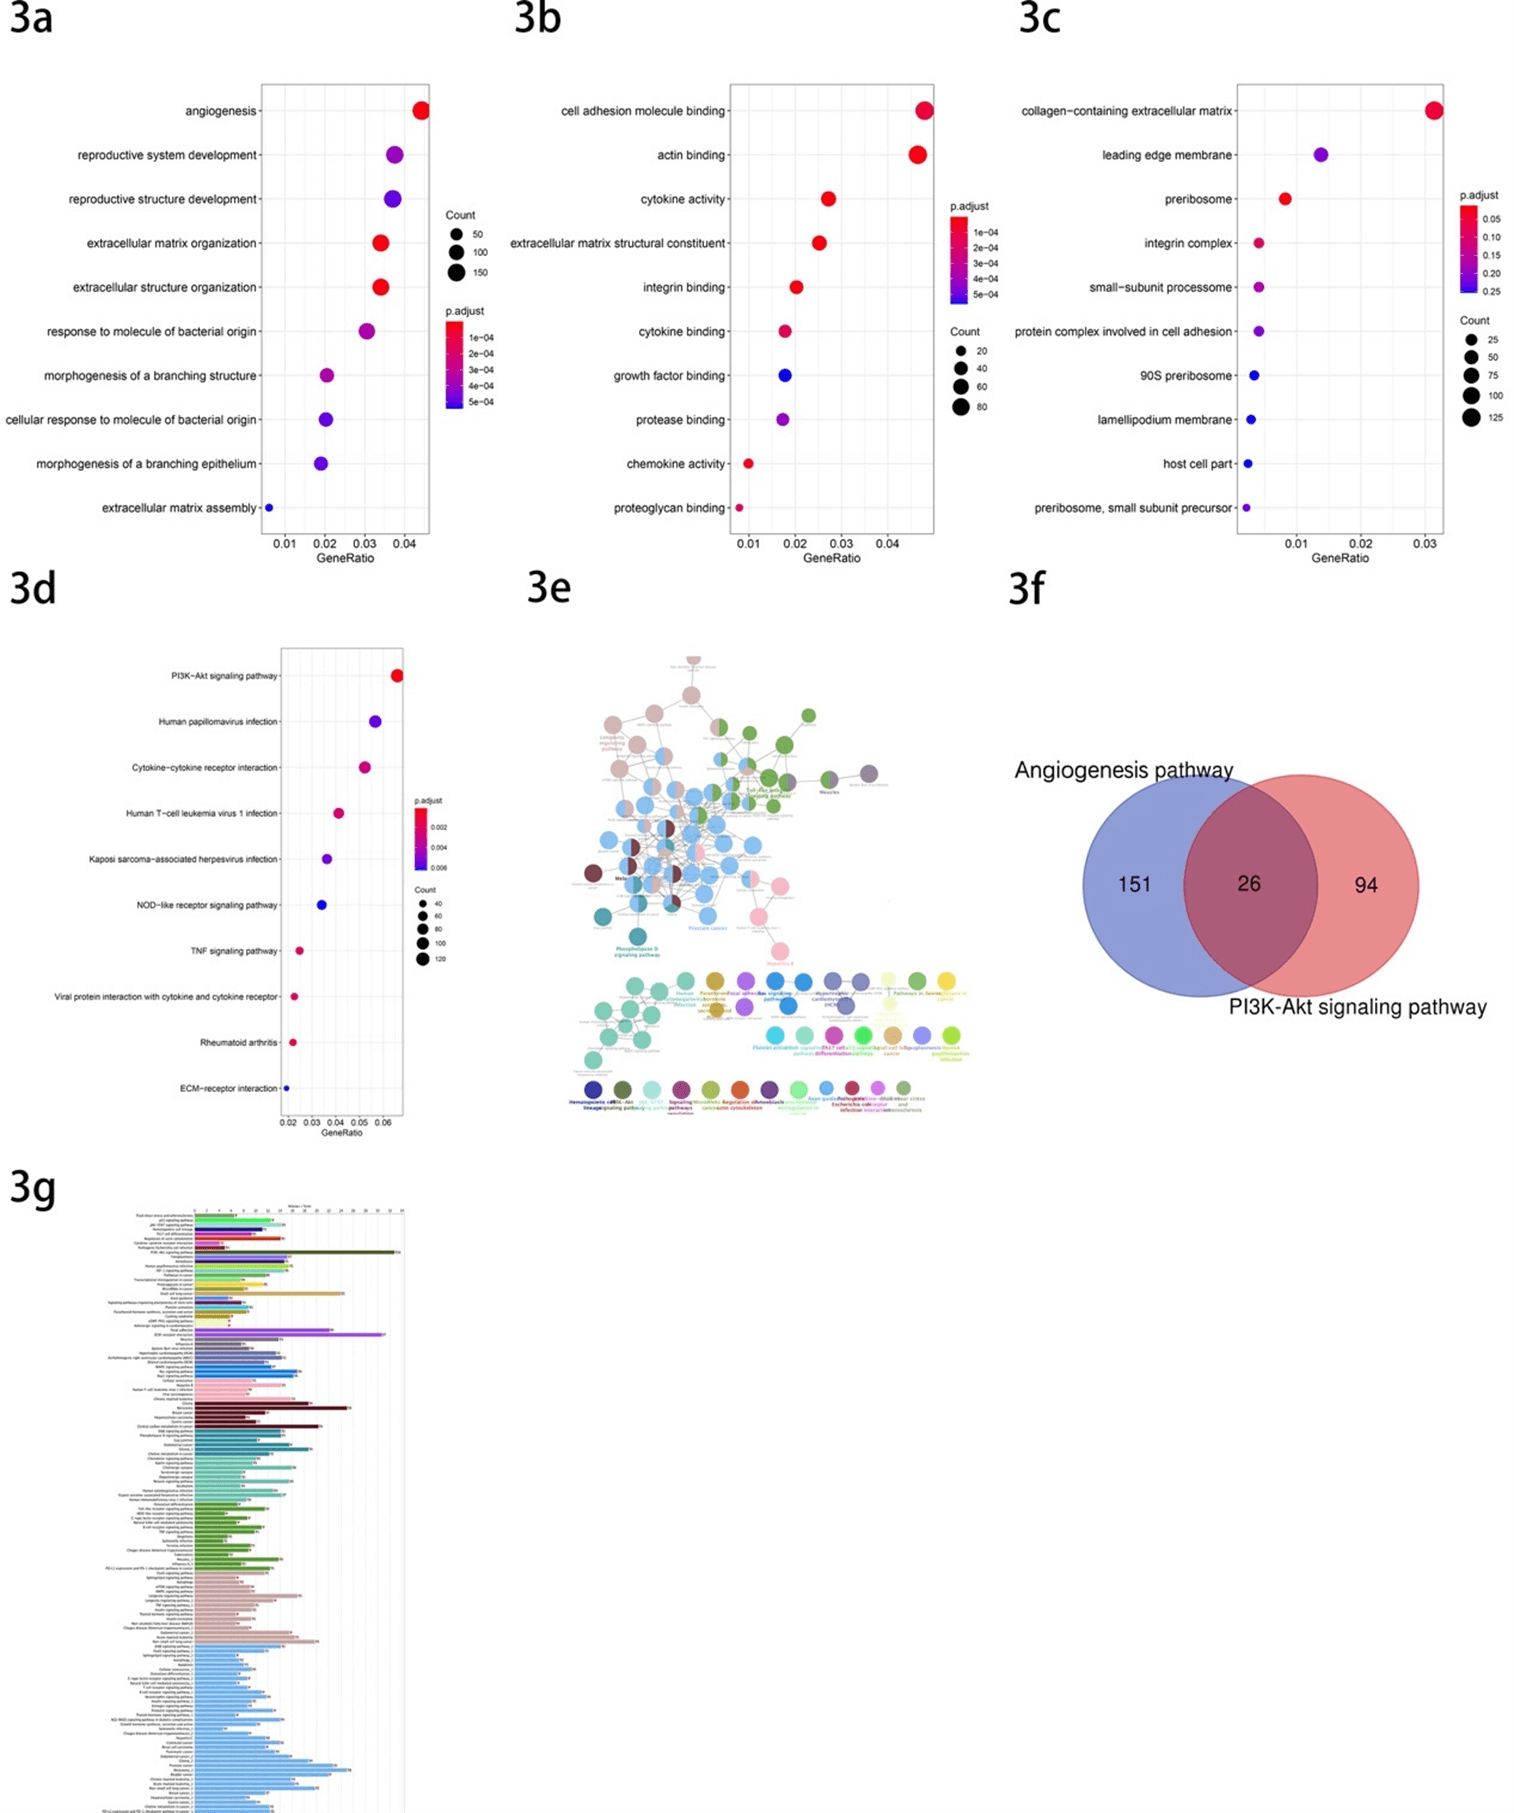
Figure 3: GO and KEGG enrichment analysis a) The GO biological process (BP) enrichment analysis. b) The GO molecular function (MF) analysis. c) The GO cellular component (CC) enrichment analysis. d) The KEGG enrichment analysis. e) The interrelation between pathways of KEGG. f) Venn diagram showed the common gene of candidate genes. g) Numbers of genes enriched in the certain pathway. GO: Gene Ontology; KEGG: Kyoto Encyclopedia of Genes and Genomes.
Table 1: DEGs identified from selected pathways of GO and KEGG.
|
DEGs |
Genes |
|
Angiogenesis pathway |
ABL1, ACVR1, ACVRL1, ADM, AKT3, AMOTL2, ANG, ANGPTL4, ANGPTL6, ANXA2,
AQP1, ARHGAP22, C3, CARD10, CAV1, CCBE1, CCL2, CD40, CDH13, CELA1, CHI3L1,
CHRNA7, COL18A1, COL8A2, CYP1B1, DCN, DDAH1, DLL4, E2F7, ECM1, EFNA1, EFNA3,
EGFL7, ELK3, EMP2, ENPP2, EPAS1, EPHA2, EPHB2, EREG, ESM1, FAP, FGF2, FLT1,
FN1, FZD5, GATA6, GBX2, GPNMB, GPR4, GREM1, HDAC9, HEY1, HLA-G, HMOX1, HOXB13,
HPSE, HTATIP2, ID1, IL18, IL1A, IL1B, IL6, ITGAX, ITGB1, ITGB2, ITGB8, KLF5,
LEF1, LOXL2, LRG1, MAPK14, MDK, MFGE8, MMP14, MMP2, NFATC4, NGFR, NOTCH3,
NRP1, NRP2, PARVA, PDGFRA, PDGFRB, PGF, PGK1, PLCD1, PLK2, PPARG, PRKD2,
PTGS2, PTK2, PTN, PTPRM, RAMP3, RBM15, RHOB, RNF213, RORA, RRAS, SASH1, SAT,
SERPINE1, SERPINF1, SFRP1, SFRP2, SMAD1, SOX17, SPARC, SRPX2, SYNJ2BP, TGFBI,
THBS1, THBS2, THY1, TIE1, TNFAIP3, TNFSF12, TWIST1, VASH1, VEGFC, WNT5A, ADM2,
AGGF1, ANGPT1, ANGPT2, BRCA1, CCR2, CX3CL1, CXCR2, CYBB, DAB2IP, DAG1, ECSCR,
EFNB2, EMILIN1, EPHA1, F3, FBXW7, FGF18, FGFBP1, FGFR1, FOXJ2, GATA2, GPLD1,
HHEX, HOXA7, IHH, JAG1, JUN, KRIT1, LEMD3, MAPK7, MED1, NCL, NOTCH4, NPPB,
NRAR, PDE3B, PIK3CG, PKNOX1, POFUT1, PRKX, ROCK2, SETD2, SIRT1, SOX18, SPRED1,
SPRY2, SRF, STAB1, SYK, TBX1, TERT, TGFBR1, THSD7A, UBP1 |
|
PI3K-Akt signaling pathway |
TCL1B, GNGT2, OSMR, GNG11, GNG10, IGF2, IGF1R, LAMB2, LAMB3, BCL2,
GNG7, F2R,, LAMA1, COL9A3, MYB, LAMA4, EIF4EBP1, LAMB1, ITGA11, THBS1,
PDGFRA, THBS2, TNC, GNG12, pik3ap1, INSR, FGF18, LPAR1, RXRA, MET, HRAS,
LPAR5, HSP90B1, AREG, KIT, CCND2, PDGFC, FLT3, RPTOR, FLT1, PDGFRB, LPAR4,
PIK3CG, PIK3R1, CCNE2, ITGA1, IKBKB, FN1, AKT3, SOS2, IRS1, CREB3, CDC37,
KITLG, NRAS, IL3RA, Ifna4, CDK6, IL2RB, NGFR, CDK4, BRCA1, IL2RA, JAK2,
THEM4, JAK3, EREG, ITGA2B, ITGA3, TLR4, ITGB4, MAPK3, ITGB5, CREB3L2, ITGB7,
PIK3R5, IL6R, ANGPT1, TLR2, ANGPT2, EFNA1, GYS2, IL6, CDKN1A, TSC2ITGB1, PGF,
YWHAB, PTK2, EFNA3, NFKB1, SPP1, SYK, VEGFC, CSF3, GNG2, FGF2, LAMC3, IFNB1 |
III Screening Candidate Genes Through Protein-Protein Interaction (PPI) Network
In order to further understand the DEGs, we displayed the protein-protein interaction (PPI) network, including all the DEGs in the two selected pathways mentioned above in STRING (Figures 4a & 4b). Then, cytoHubba plug-ins in Cytoscape were also used to screen out the top 30 candidate hub genes of each pathway according to nodes rank (Figures 4c & 4d), and all the top hub genes have been listed in (Table 2). In this part, we identified 4 common genes in the two sets of top 30 hub genes, including FN1, THBS1, ITGB1 and THBS2, as candidate hub genes.
Table 2: The top 30 genes with the highest score of each pathway through the
Cytoscape “cytoHubba” module analysis.
|
Angiogenesis pathway |
PI3K-Akt signaling pathway |
||||
|
Rank |
Name |
Score |
Rank |
Name |
Score |
|
1 |
FN1 |
1.68E+08 |
1 |
PTK2 |
7.42E+14 |
|
2 |
CCL2 |
1.67E+08 |
2 |
ITGB1 |
7.42E+14 |
|
3 |
MMP2 |
1.65E+08 |
3 |
ITGA3 |
7.42E+14 |
|
4 |
FGF2 |
1.58E+08 |
4 |
ITGA1 |
7.42E+14 |
|
5 |
SERPINE1 |
1.38E+08 |
5 |
ITGA2B |
7.42E+14 |
|
6 |
THBS1 |
1.33E+08 |
6 |
ITGB5 |
7.42E+14 |
|
7 |
IL6 |
1.24E+08 |
6 |
ITGA11 |
7.42E+14 |
|
8 |
VEGFC |
1.21E+08 |
8 |
ITGB7 |
7.42E+14 |
|
9 |
FLT1 |
1.07E+08 |
9 |
ITGB4 |
7.40E+14 |
|
10 |
PGF |
1.07E+08 |
10 |
ITGB8 |
7.40E+14 |
|
11 |
ANGPT2 |
1.04E+08 |
10 |
ITGA10 |
7.40E+14 |
|
12 |
ANGPT1 |
1.00E+08 |
12 |
COL1A1 |
7.18E+14 |
|
13 |
PTGS2 |
6.38E+07 |
13 |
COL1A2 |
7.17E+14 |
|
14 |
COL18A1 |
4.98E+07 |
14 |
COL6A1 |
7.17E+14 |
|
15 |
IL1B |
4.08E+07 |
15 |
COL6A3 |
7.15E+14 |
|
16 |
JUN |
3.63E+07 |
16 |
COL6A2 |
7.14E+14 |
|
17 |
HMOX1 |
3.31E+07 |
17 |
LAMA4 |
3.83E+14 |
|
18 |
MMP14 |
2.35E+07 |
18 |
LAMB1 |
3.82E+14 |
|
19 |
PPARG |
2.18E+07 |
19 |
THBS2 |
3.58E+14 |
|
20 |
CAV1 |
1.86E+07 |
20 |
COL9A3 |
3.56E+14 |
|
21 |
IL18 |
1.73E+07 |
21 |
LAMB2 |
2.37E+13 |
|
22 |
MAPK14 |
1.58E+07 |
22 |
LAMA1 |
2.36E+13 |
|
23 |
ITGB1 |
1.34E+07 |
23 |
LAMC3 |
2.10E+13 |
|
24 |
PDGFRB |
1.30E+07 |
24 |
LAMB3 |
2.09E+13 |
|
25 |
SIRT1 |
1.10E+07 |
25 |
THBS1 |
3.95E+12 |
|
26 |
F3 |
7622520 |
26 |
SPP1 |
1.58E+12 |
|
27 |
ANG |
7258344 |
27 |
FN1 |
1.43E+12 |
|
28 |
THBS2 |
6250378 |
28 |
TNC |
9.39E+10 |
|
29 |
IL1A |
5449080 |
29 |
PIK3CG |
6.24E+09 |
|
30 |
CYBB |
3774960 |
30 |
PIK3R1 |
6.24E+09 |
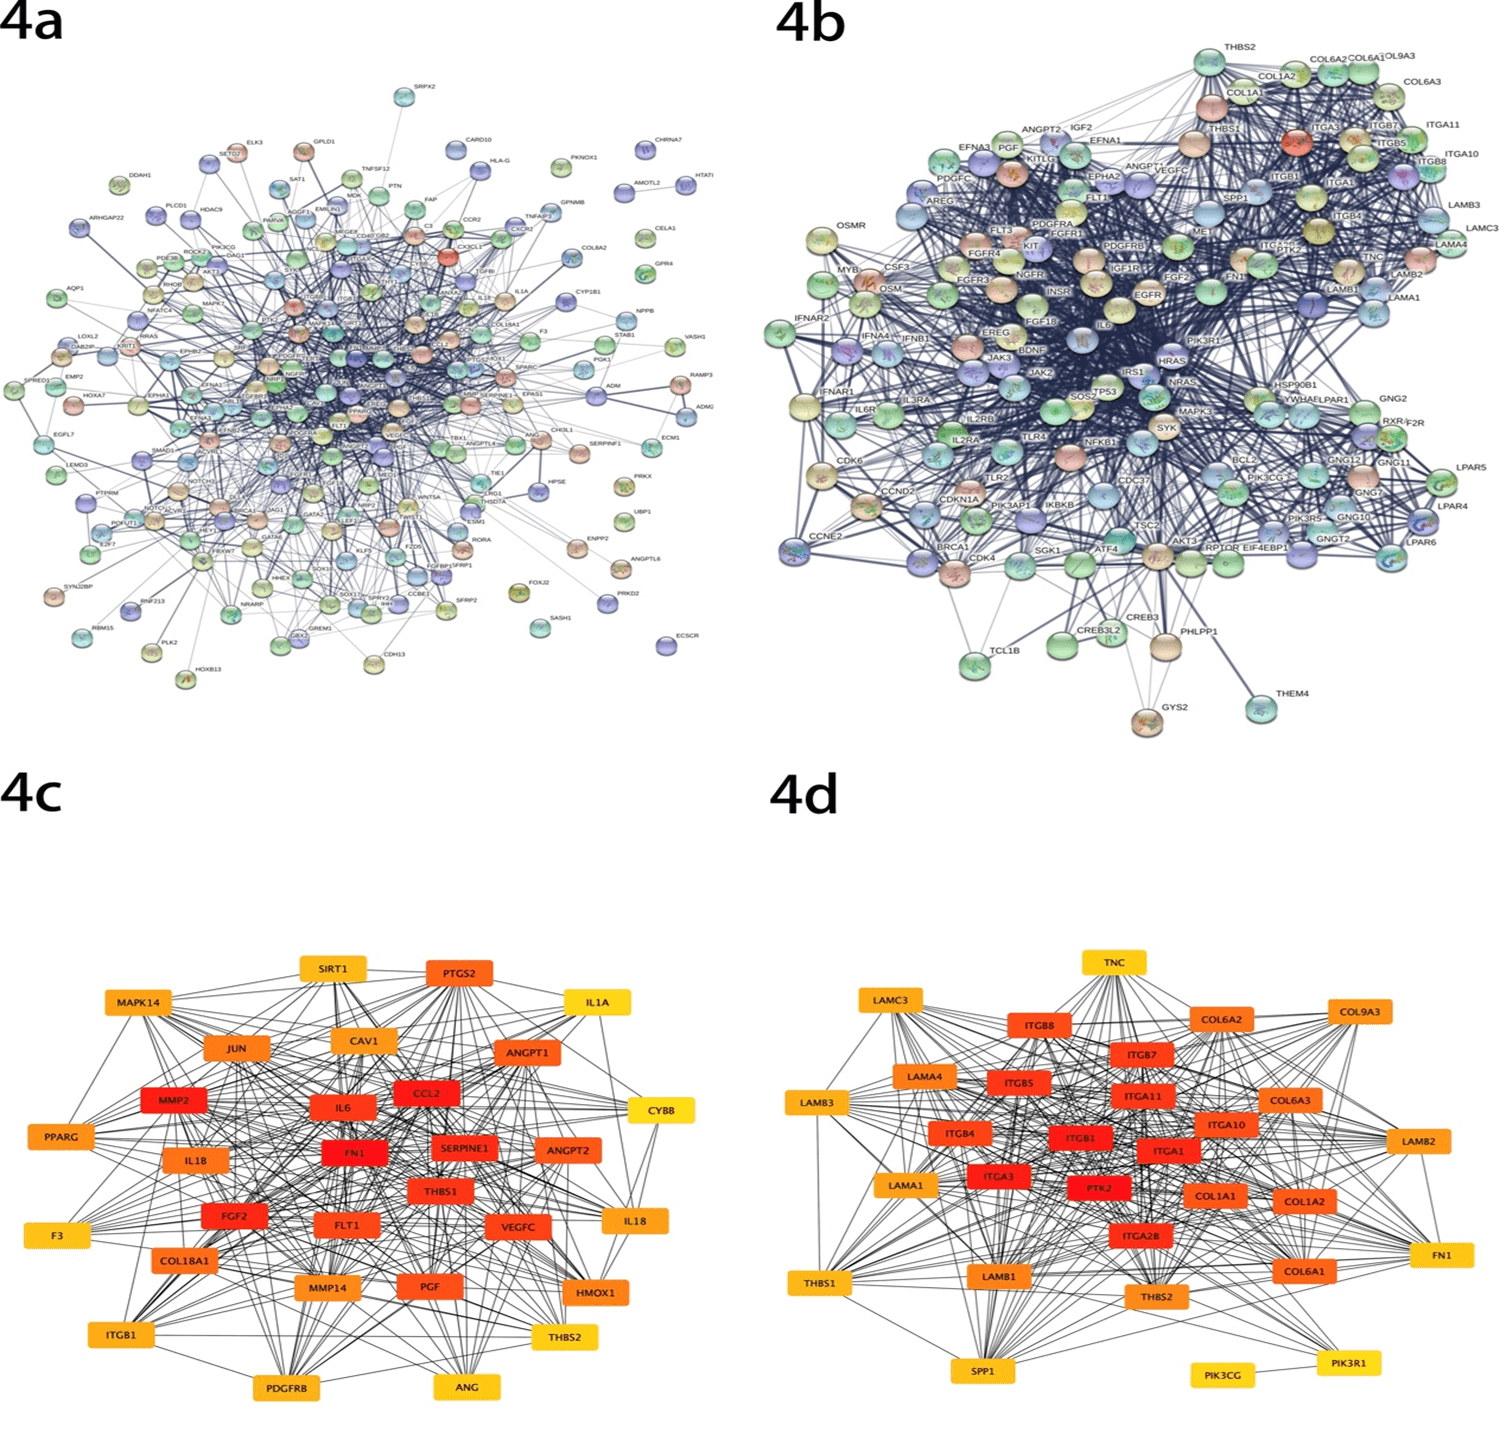
Figure 4: Protein-protein interaction (PPI) analysis a) Genes identified from angiogenesis pathway. b) Genes identified from PI3K-Akt signaling pathway. c) Analysis of the interaction of top 30 genes from angiogenesis pathway. d) Analysis of the interaction of top 30 genes from PI3K-Akt signaling pathway.
IV Selecting Candidate Genes and Conducting Survival Analysis
Subsequently, the correlation between hub genes and prognosis of AML patients was analysed through PrognoScan and GEPIA online survival website. The results showed that except for the ITGB1 gene, as the result of no survival significance, the other genes were removed. We found that patients with high expression of ITGB1 had significantly longer overall survival (OS) than those with low expression (COX p-value= 0.016730) (Figures 5a & 5b). Besides, through the online website GEPIA, we performed a visual analysis of the expression of hub gene ITGB1 in the TCGA database in AML patients and normal people, showing that the expression of the ITGB1 gene in AML patients is lower than that in normal people significantly (p-value<0.01) (Figure 5c).
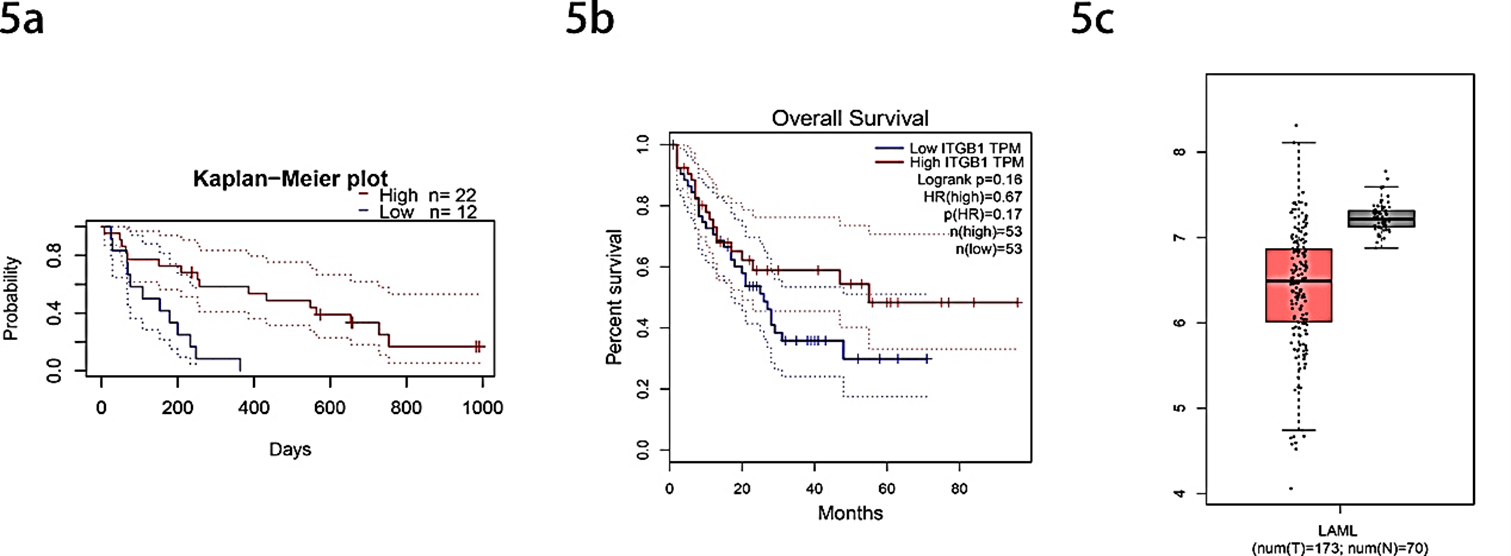
Figure 5: Analysis of selected hub gene ITGB1. a) Kaplan-Meier survival curves comparing high and low expression of ITGB1 in AML patients with PrognoScan (COX p-value= 0.016730). b) Survival analysis curves comparing high and low expression of ITGB1 in AML patients with GEPIA (p-value <0.05). c) Comparation the expression of ITGB1 of AML patients and normal people (p-value <0.01).
Discussion
With the elucidation of molecular mechanisms and the emergence of targeted therapies, the treatment of AML has made great progress, and the overall survival rate of patients has been significantly improved. However, the resistance of leukemia cells and the recurrence after treatment are still two major problems that plague us. We now believe that the protective effect of leukemia stem cells (LSCs) mediated by the bone marrow microenvironment is also an important factor for the refractory and recurrence of leukemia. Recent studies have shown that there is a complex interaction between leukemia cells and the bone marrow microenvironment. The two induce and support each other, which together lead to the occurrence and development of the disease.
In this study, we analysed 32080 DEGs between cultured alone and co-cultured with stomal cells AML cells based on the GSE73157 dataset. Then, we used GO enrichment analysis and KEGG pathway analysis to detect the dataset to explore the interaction between DEGs. GO analysis showed that these genes mainly reacted with the process of angiogenesis, collagen-containing extracellular matrix production and cytokine binding, suggesting that these DEGs may be involved in improving the ability of tumor cells to migrate and invade, promoting metastasis, recurrence and multiple drug resistance of cancer [22, 23]. KEGG analysis illustrated that 120 DEGs mainly affect the AML cells through the PI3K-Akt signaling pathway. As we all know, the phosphatidylinositol 3-kinase/protein kinase B/mammalian target of rapamycin (PI3K/Akt/mTOR) signaling pathway is over-activated in hematological malignancies, and the development of inhibitors of the PI3K/Akt/mTOR signaling pathway has become a common concern for hematology researchers in recent years [24]. Excessive activation of this pathway may promote tumor proliferation and weaken the immune monitoring of tumor cells [25]. At the same time, we utilized the online tool STRING to display the functional interaction between proteins to discover the underlying mechanism of occurrence of the development of AML. And then, using the software Cytoscape 3.8.1 to analyse the protein interaction network diagram, we screened out FN1, THBS1, ITGB1, THBS2 as 4 candidate hub genes. The above 4 candidate genes not only interact closely with other genes but may also determine the functions of other genes. After further survival analysis of the 4 selected genes, we found that only the ITGB1 gene is statistically significant. We found that the expression of ITGB1 is negatively correlated with the prognosis of AML. Furthermore, compared with normal people, the expression of ITGB1 is significantly lower in AML patients. That is, ITGB1 may be a key gene for evaluating the prognosis and conducting targeted therapy of AML patients.
A huge amount of evidence shows that integrin family molecules are involved in the occurrence and development of tumors and play an important role in regulating tumor cell proliferation, invasion and metastasis and other biological behaviours [26]. Integrin β1 (ITGB1) is a relatively important part of molecules in the cell adhesion molecule family and is the main receptor that mediates the interaction between cells and the extracellular matrix. This saying is consistent with our above analysis results: the bone marrow microenvironment may affect AML cells by regulating cell adhesion molecules and extracellular matrix. At present, our understanding of ITGB1 is limited to the primary stage, and its biological functions are not yet very clear. In the direction of solid tumors, there are certain studies on the direction of ITGB1, but there are few reports on the research of ITGB1 of hematological tumors in the world. In summary, ITGB1 may be a potential marker for predicting and guiding the treatment of AML, which requires further attention and research.
Conclusion
In summary, ITGB1 was a hub gene related to the bone microenvironment mediated poor prognosis in AML. The expression of ITGB1 was negatively correlated with the prognosis of AML. This study used bioinformatics methods to analyse the relevant data of AML research to obtain potential markers for predicting and guiding AML treatment, which provides a theoretical basis for a deeper understanding of the occurrence and development of AML, and also give the follow-up animal experiments and clinical trials research directions.
Author Contributions
XYZ, NJ and BAC were responsible for confirming the topic, collecting the data and analysing article. XYZ designed and wrote the paper, edited the figures, legends and tables. All authors read and approved the final manuscript.
Ethics Approval and Consent to Participate
Not applicable.
Consent for Publication
Not applicable.
Availability of Data and Materials
The dataset analysed during the current study are available in the NCBI-GEO repository (Link 6).
Conflicts of Interest
None.
Funding
This work was supported by The Natural Science Foundation of Jiangsu Province (BK20150639); Key Medical of Jiangsu Province (ZDXKB2016020); Six talent peaks project in Jiangsu Province (WSW-033); Jiangsu Provincial Medical Youth Talent (QNRC2016813).
Acknowledgement
Not applicable.
Abbreviation
AML: Acute Myeloid Leukemia
MDR: Multidrug Resistance
ITGB1: Integrin β1
NCBI-GEO: National Center for Biotechnology Information-Gene Expression Omnibus database
DEGs: Differentially Expressed Genes
GO: Gene Ontology
KEGG: Kyoto Encyclopedia of Genes and Genomes
PPI: Protein-Protein Interaction
OS: Overall Survival
LSCs: Leukemia Stem Cells
ATO: Arsenic Trioxide
BP: Biological Process
MF: Molecular Function
CC: Cellular Component
MCC: Maxima Clique Centrality
HR: Hazard Ratio
GEPIA: Gene Expression Profiling Interaction Analysis
Article Info
Article Type
Research ArticlePublication history
Received: Wed 14, Jul 2021Accepted: Thu 29, Jul 2021
Published: Thu 12, Aug 2021
Copyright
© 2023 Bao-An Chen. This is an open-access article distributed under the terms of the Creative Commons Attribution License, which permits unrestricted use, distribution, and reproduction in any medium, provided the original author and source are credited. Hosting by Science Repository.DOI: 10.31487/j.COR.2021.08.04
Figures & Tables
Table 1: DEGs identified from selected pathways of GO and KEGG.
|
DEGs |
Genes |
|
Angiogenesis pathway |
ABL1, ACVR1, ACVRL1, ADM, AKT3, AMOTL2, ANG, ANGPTL4, ANGPTL6, ANXA2,
AQP1, ARHGAP22, C3, CARD10, CAV1, CCBE1, CCL2, CD40, CDH13, CELA1, CHI3L1,
CHRNA7, COL18A1, COL8A2, CYP1B1, DCN, DDAH1, DLL4, E2F7, ECM1, EFNA1, EFNA3,
EGFL7, ELK3, EMP2, ENPP2, EPAS1, EPHA2, EPHB2, EREG, ESM1, FAP, FGF2, FLT1,
FN1, FZD5, GATA6, GBX2, GPNMB, GPR4, GREM1, HDAC9, HEY1, HLA-G, HMOX1, HOXB13,
HPSE, HTATIP2, ID1, IL18, IL1A, IL1B, IL6, ITGAX, ITGB1, ITGB2, ITGB8, KLF5,
LEF1, LOXL2, LRG1, MAPK14, MDK, MFGE8, MMP14, MMP2, NFATC4, NGFR, NOTCH3,
NRP1, NRP2, PARVA, PDGFRA, PDGFRB, PGF, PGK1, PLCD1, PLK2, PPARG, PRKD2,
PTGS2, PTK2, PTN, PTPRM, RAMP3, RBM15, RHOB, RNF213, RORA, RRAS, SASH1, SAT,
SERPINE1, SERPINF1, SFRP1, SFRP2, SMAD1, SOX17, SPARC, SRPX2, SYNJ2BP, TGFBI,
THBS1, THBS2, THY1, TIE1, TNFAIP3, TNFSF12, TWIST1, VASH1, VEGFC, WNT5A, ADM2,
AGGF1, ANGPT1, ANGPT2, BRCA1, CCR2, CX3CL1, CXCR2, CYBB, DAB2IP, DAG1, ECSCR,
EFNB2, EMILIN1, EPHA1, F3, FBXW7, FGF18, FGFBP1, FGFR1, FOXJ2, GATA2, GPLD1,
HHEX, HOXA7, IHH, JAG1, JUN, KRIT1, LEMD3, MAPK7, MED1, NCL, NOTCH4, NPPB,
NRAR, PDE3B, PIK3CG, PKNOX1, POFUT1, PRKX, ROCK2, SETD2, SIRT1, SOX18, SPRED1,
SPRY2, SRF, STAB1, SYK, TBX1, TERT, TGFBR1, THSD7A, UBP1 |
|
PI3K-Akt signaling pathway |
TCL1B, GNGT2, OSMR, GNG11, GNG10, IGF2, IGF1R, LAMB2, LAMB3, BCL2,
GNG7, F2R,, LAMA1, COL9A3, MYB, LAMA4, EIF4EBP1, LAMB1, ITGA11, THBS1,
PDGFRA, THBS2, TNC, GNG12, pik3ap1, INSR, FGF18, LPAR1, RXRA, MET, HRAS,
LPAR5, HSP90B1, AREG, KIT, CCND2, PDGFC, FLT3, RPTOR, FLT1, PDGFRB, LPAR4,
PIK3CG, PIK3R1, CCNE2, ITGA1, IKBKB, FN1, AKT3, SOS2, IRS1, CREB3, CDC37,
KITLG, NRAS, IL3RA, Ifna4, CDK6, IL2RB, NGFR, CDK4, BRCA1, IL2RA, JAK2,
THEM4, JAK3, EREG, ITGA2B, ITGA3, TLR4, ITGB4, MAPK3, ITGB5, CREB3L2, ITGB7,
PIK3R5, IL6R, ANGPT1, TLR2, ANGPT2, EFNA1, GYS2, IL6, CDKN1A, TSC2ITGB1, PGF,
YWHAB, PTK2, EFNA3, NFKB1, SPP1, SYK, VEGFC, CSF3, GNG2, FGF2, LAMC3, IFNB1 |
Table 2: The top 30 genes with the highest score of each pathway through the
Cytoscape “cytoHubba” module analysis.
|
Angiogenesis pathway |
PI3K-Akt signaling pathway |
||||
|
Rank |
Name |
Score |
Rank |
Name |
Score |
|
1 |
FN1 |
1.68E+08 |
1 |
PTK2 |
7.42E+14 |
|
2 |
CCL2 |
1.67E+08 |
2 |
ITGB1 |
7.42E+14 |
|
3 |
MMP2 |
1.65E+08 |
3 |
ITGA3 |
7.42E+14 |
|
4 |
FGF2 |
1.58E+08 |
4 |
ITGA1 |
7.42E+14 |
|
5 |
SERPINE1 |
1.38E+08 |
5 |
ITGA2B |
7.42E+14 |
|
6 |
THBS1 |
1.33E+08 |
6 |
ITGB5 |
7.42E+14 |
|
7 |
IL6 |
1.24E+08 |
6 |
ITGA11 |
7.42E+14 |
|
8 |
VEGFC |
1.21E+08 |
8 |
ITGB7 |
7.42E+14 |
|
9 |
FLT1 |
1.07E+08 |
9 |
ITGB4 |
7.40E+14 |
|
10 |
PGF |
1.07E+08 |
10 |
ITGB8 |
7.40E+14 |
|
11 |
ANGPT2 |
1.04E+08 |
10 |
ITGA10 |
7.40E+14 |
|
12 |
ANGPT1 |
1.00E+08 |
12 |
COL1A1 |
7.18E+14 |
|
13 |
PTGS2 |
6.38E+07 |
13 |
COL1A2 |
7.17E+14 |
|
14 |
COL18A1 |
4.98E+07 |
14 |
COL6A1 |
7.17E+14 |
|
15 |
IL1B |
4.08E+07 |
15 |
COL6A3 |
7.15E+14 |
|
16 |
JUN |
3.63E+07 |
16 |
COL6A2 |
7.14E+14 |
|
17 |
HMOX1 |
3.31E+07 |
17 |
LAMA4 |
3.83E+14 |
|
18 |
MMP14 |
2.35E+07 |
18 |
LAMB1 |
3.82E+14 |
|
19 |
PPARG |
2.18E+07 |
19 |
THBS2 |
3.58E+14 |
|
20 |
CAV1 |
1.86E+07 |
20 |
COL9A3 |
3.56E+14 |
|
21 |
IL18 |
1.73E+07 |
21 |
LAMB2 |
2.37E+13 |
|
22 |
MAPK14 |
1.58E+07 |
22 |
LAMA1 |
2.36E+13 |
|
23 |
ITGB1 |
1.34E+07 |
23 |
LAMC3 |
2.10E+13 |
|
24 |
PDGFRB |
1.30E+07 |
24 |
LAMB3 |
2.09E+13 |
|
25 |
SIRT1 |
1.10E+07 |
25 |
THBS1 |
3.95E+12 |
|
26 |
F3 |
7622520 |
26 |
SPP1 |
1.58E+12 |
|
27 |
ANG |
7258344 |
27 |
FN1 |
1.43E+12 |
|
28 |
THBS2 |
6250378 |
28 |
TNC |
9.39E+10 |
|
29 |
IL1A |
5449080 |
29 |
PIK3CG |
6.24E+09 |
|
30 |
CYBB |
3774960 |
30 |
PIK3R1 |
6.24E+09 |
References
1.
Siegel RL, Miller
KD, Jemal A (2020) Cancer statistics, 2020. CA Cancer J Clin 70: 7-30. [Crossref]
2.
Kfoury Y, Scadden
DT (2015) Mesenchymal cell contributions to the stem cell niche. Cell Stem
Cell 16: 239-253. [Crossref]
3.
Krause DS,
Fulzele K, Catic A, Sun CC, Dombkowski D et al. (2013) Differential regulation
of myeloid leukemias by the bone marrow microenvironment. Nat Med 19:
1513-1517. [Crossref]
4.
Frisch BJ, Ashton
JM, Xing L, Becker MW, Jordan CT et al. (2012) Functional inhibition of
osteoblastic cells in an in vivo mouse model of myeloid leukemia. Blood
119: 540-550. [Crossref]
5.
Fulzele K, Krause
DS, Panaroni C, Saini V, Barry KJ et al. (2013) Myelopoiesis is regulated by
osteocytes through Gsα-dependent signaling. Blood 121: 930-939. [Crossref]
6.
Welner RS,
Amabile G, Bararia D, Czibere A, Yang H et al. (2015) Treatment of chronic
myelogenous leukemia by blocking cytokine alterations found in normal stem and
progenitor cells. Cancer Cell 27: 671-681. [Crossref]
7.
Flavell RA,
Sanjabi S, Wrzesinski SH, Licona Limón P (2010) The polarization of immune
cells in the tumour environment by TGFbeta. Nat Rev Immunol 10: 554-567.
[Crossref]
8.
Massagué J (2008) TGFbeta in Cancer. Cell 134:
215-230. [Crossref]
9.
Sugiyama T,
Kohara H, Noda M, Nagasawa T (2006) Maintenance of the hematopoietic stem cell
pool by CXCL12-CXCR4 chemokine signaling in bone marrow stromal cell niches. Immunity
25: 977-988. [Crossref]
10.
Dillmann F,
Veldwijk MR, Laufs S, Sperandio M, Calandra G et al. (2009) Plerixafor inhibits
chemotaxis toward SDF-1 and CXCR4-mediated stroma contact in a dose-dependent
manner resulting in increased susceptibility of BCR-ABL+ cell to Imatinib and
Nilotinib. Leuk Lymphoma 50: 1676-1686. [Crossref]
11.
Hazlehurst LA,
Landowski TH, Dalton WS (2003) Role of the tumor microenvironment in mediating
de novo resistance to drugs and physiological mediators of cell death. Oncogene
22: 7396-7402. [Crossref]
12.
Colmone A, Amorim
M, Pontier AL, Wang S, Jablonski E et al. (2008) Leukemic cells create bone
marrow niches that disrupt the behavior of normal hematopoietic progenitor
cells. Science 322: 1861-1865. [Crossref]
13.
Barrett T,
Wilhite SE, Ledoux P, Evangelista C, Kim IF et al. (2013) NCBI GEO: archive for
functional genomics data sets--update. Nucleic Acids Res 41: D991- D995.
[Crossref]
14.
Ritchie ME,
Phipson B, Wu D, Hu Y, Law CW et al. (2015) limma powers differential
expression analyses for RNA-sequencing and microarray studies. Nucleic Acids
Res 43: e47. [Crossref]
15.
Ito K, Murphy D
(2013) Application of ggplot2 to Pharmacometric Graphics. CPT
Pharmacometrics Syst Pharmacol 2: e79. [Crossref]
16.
Yu G, Wang LG,
Han Y, He QY (2012) clusterProfiler: an R package for comparing biological
themes among gene clusters. OMICS 16: 284-287. [Crossref]
17.
Walter W, Sánchez
Cabo F, Ricote M (2015) GOplot: an R package for visually combining expression
data with functional analysis. Bioinformatics 31: 2912-2914. [Crossref]
18.
Shannon P,
Markiel A, Ozier O, Baliga NS, Wang JT et al. (2003) Cytoscape: a software
environment for integrated models of biomolecular interaction networks. Genome
Res 13: 2498-2504. [Crossref]
19.
Szklarczyk D,
Gable AL, Lyon D, Junge A, Wyder S et al. (2019) STRING v11: protein-protein
association networks with increased coverage, supporting functional discovery
in genome-wide experimental datasets. Nucleic Acids Res 47: D607-D613. [Crossref]
20.
Mizuno H, Kitada
K, Nakai K, Sarai A (2009) PrognoScan: a new database for meta-analysis of the
prognostic value of genes. BMC Med Genomics 2: 18. [Crossref]
21.
Tang Z, Li C, Kang B, Gao G, Li C et al. (2017) GEPIA: a web server for cancer and normal gene
expression profiling and interactive analyses. Nucleic Acids Res 45:
W98-W102. [Crossref]
22.
Li T, Kang G,
Wang T, Huang H (2018) Tumor angiogenesis and anti-angiogenic gene therapy for
cancer. Oncol Lett 16: 687-702. [Crossref]
23.
Terranova VP,
Maslow D, Markus G (1989) Directed migration of murine and human tumor cells to
collagenases and other proteases. Cancer Res 49: 4835-4841. [Crossref]
24.
Gao Y, Yuan CY,
Yuan W (2016) Will targeting PI3K/Akt/mTOR signaling work in hematopoietic
malignancies? Stem Cell Investig 3: 31. [Crossref]
25. O'Donnell JS, Massi D, Teng MWL, Mandala M (2018) PI3K-AKT-mTOR inhibition in cancer immunotherapy, redux. Semin Cancer Biol 48: 91-103. [Crossref]
26. Kapp TG, Rechenmacher F, Sobahi TR, Kessler H et al. (2013) Integrin modulators: a patent review. Expert Opin Ther Pat 23: 1273-1295. [Crossref]