Journals
Differentiation between stage I ovarian cancer and borderline epithelial ovarian tumor by apparent diffusion coefficient value
A B S T R A C T
Purpose: To To clarify usefulness of apparent diffusion coefficient (ADC) value in the differential diagnosis of stage I malignant epithelial ovarian tumor (MOT) and borderline epithelial ovarian tumor (BOT), the ADC value of the solid portion or thickened wall of ovarian tumors was evaluated by a 1.5-T magnetic resonance imaging system in 18 cases of BOT and MOT. The median of average ADC value was 1.668 × 10⁻³ mm2/s for BOT and 1.021 × 10⁻³ mm2/s for MOT (p = 0.0005), and the median of minimum ADC value was 1.394 × 10⁻³ mm2/s for BOT and 0.812× 10⁻³ mm2/s for MOT (p = 0.0006), both of which were significantly lower in MOT than that in BOT. So the ADC value is useful and especially the minimum ADC value is useful in that it can easily measure the ROI so that it contains solid portion or thickened wall.
K E Y W O R D S
Apparent diffusion coefficient value, borderline epithelial ovarian tumor, differential diagnosis, magnetic resonance imaging,malignant epithelial ovarian tumor
I N T R O D U C T I O N
Preoperative diagnosis of ovarian tumors is mainly performed by imaging techniques such as ultrasonography, computed tomography (CT), and magnetic resonance imaging (MRI). The accuracy of the preoperative and intraoperative frozen section diagnosis for borderline epithelial ovarian tumors (BOTs) is reported to be about 60%-75% owing to the heterogeneity of tumor cells and large tumor size [1, 2]. The operation mode for ovarian tumors is sometimes determined by an intraoperative frozen section, and fertility preservation is also considered in patients with BOT according to the patients’ wish. BOTs have a much better prognosis [3, 4] than malignant epithelial ovarian tumors (MOTs), and fertility preservation is a very important issue in young patients [5]. A vast majority of BOTs are limited to the ovary at the initial presentation with 75% being diagnosed as International Federation of Gynecology and Obstetrics (FIGO) stage I, compared with those of MOTs, which are diagnosed at an early stage only in 10% of the patients [6]. If the accurate diagnosis of BOTs could be preoperatively obtained, fertility preservation would be easily prepared. Recently, the apparent diffusion coefficient (ADC) value in MRI diffusion-weighted imaging (DWI), which has the potential to replace contrast-enhanced sequences, is increasingly used for the differential diagnosis between BOT and MOT [7-9]. The ADC value may be an index that indirectly captures the properties of the tumor [10].
We investigated the usefulness of ADC value in the solid portion or thickened wall of ovarian tumors for the differential diagnosis of FIGO stage I BOTs from MOTs. In particular, we examined a method that a gynecologist can easily evaluate.
Material and Methods
This retrospective study was conducted according to the principles stated in the 1964 Declaration of Helsinki with subsequent revisions and was approved by the Institutional Review Board of our university on May 29, 2017 (#1103).
Of the 226 patients who underwent laparotomy under the diagnosis of BOT or MOT at University of the Ryukyus Hospital from February 2011 to January 2017, 141 were pathologically diagnosed as having BOTs or MOTs. In the preoperative image, there were 35 patients with solid portion or thickened wall on MRI and MRI underwent at our hospital. Among them, 18 cases of stage I and b values relatively close when creating ADC map were targeted (In particular, b values are 10 cases (0,800,1000), 2cases (0,600,1000), 6cases (0,600,800)). An average ADC value and a minimum ADC value of the ADC map were taken as main evaluation items, and the following patients background was extracted (age, histological subtype, surgical procedures, serum CA125 value, tumor diameter and morphology on MRI, degree of signal intensity (SI) on DWI).
A 1.5-T MRI system (Magnetom Avanto, Simens, Erlangen, Germany) was used with a phased-array coil. All patients underwent DWI in addition to imaging studies using a routine ovarian MRI protocol. An antiperistaltic agent (20 mg butylscopolamine) was administered intramuscularly or intravenously before MRI examination to reduce artifacts due to bowel peristalsis. Axial echo-planar DWI was mainly performed using the following parameters: repetition time/ echo time = 5000/ 80 ms, b values = 0, 600, 800 and 1000 s/mm2 (3 points including 0 s/mm2 and upper limit is mainly 1000 s/mm2), field of view = 35 * 35 cm, slice thickness/ gap = 5/ 2.5 mm, number of excitations = 2, matrix size = 128×128. The time required to acquire the DWI set was 1 minutes and 27 seconds. The tumors were morphologically divided into four groups i.e., cystic including thickened wall, cystic with some papillary nodules, cystic mixed with solid portion, and solid, on the T2-weighted and the contrast T1-weighted images, and they were classified into three groups according to the degree of SI on DWI i.e., high: similar to SI of nerve root; moderate: similar to SI of small intestinal wall; and low: lower than SI of small intestinal wall. Measurement of the ADC value was carried out by setting a region of interest (ROI) at a site where the solid part or thickened wall was observed. If the range of ROI in the solid part was 1 cm2 or more, the measured average ADC value were used (to the extent that it does not exceed the solid part, it is a circle or ellipse) (Figure 1), and the ROI set to contain the solid part or thickened wall was less than 1 cm2, the similar solid part or thickened wall was measured at several places (total ROI > 1 cm2) to obtain the average ADC value (Figure 2). Because variations were expected for the average ADC value, to evaluate the inter-measurement error of the average ADC value, we also examined the correlation between the measured values of the two examiners (YI; a radiologist and TN; a gynecologic oncologist). For the minimum ADC value, set the ROI so as to fully cover the solid portion or thickened wall, and used the minimum value.
Statistical analyses were performed by the Fisher’s exact test and the Wilcoxon test using JMP 10.0 (SAS Institute, Cary, NC, USA). The cutoff value of each ADC value was obtained from the receiver operating characteristic (ROC) curve. The Spearman rank was used for the correlation between the average ADC values obtained by the two examiners.
Results
The characteristics of patients with BOTs and MOTs are shown in Table 1. The median age was 40 years (range, 27–73 years) in patients with BOT and 57 years (range, 35–68 years) in those with MOT. With regard to histological subtype, 8 of 11 BOTs were mucinous tumors and 6 of 7 MOTs were clear cell carcinomas; no serous adenocarcinoma was observed in our study patients. There were no significant differences between patients with BOTs and those with MOTs in age, serum CA125 value, surgical procedure, and tumor diameter on MRI the degree of SI on DWI of the solid part or thickened wall part. We observed significant difference in the morphology of the tumor classified with MRI.
Table 1. Characteristics of patients and MRI morphology and signal intensity of diffusion-weighted imaging of solid part or thickened wall of borderline and malignant epithelial ovarian tumors.
|
|
BOTs (n = 11) |
MOTs (n = 7) |
p value |
|
Median age (years) (range) |
40 (27–73) |
57 (35–68) |
0.1126* |
|
Histological subtype Clear cell Serous Mucinous Seromucinous Endometrioid |
0 2 8 1 0 |
6 0 0 0 1 |
< 0.0001** |
|
Median CA125 (U/ml) (range) |
26 (13—65) |
22 (9—531) |
0.4680* |
|
Mode of surgery Radical Fertility sparing |
6 5 |
6 1 |
0.4633** |
|
Median tumor diameter (mm) (range) |
195 (33—296) |
142 (55—199) |
0.5867* |
|
Morphologic pattern Cystic Mainly cystic Mixed Solid |
2 9 0 0 |
0 2 2 3 |
0.0059** |
|
Signal intensity on DWI Low Moderate High |
3 7 1 |
0 3 4 |
0.0727** |
* Wilcoxon test, ** Fisher’s exact test. DWI: diffusion-weighted imaging
Cystic: cystic including thickened wall, Mainly cystic: cystic with some papillary nodules, Mixed: cystic mixed with solid portion, Solid: Almost solid
The median of average ADC value was 1.668 × 10⁻³ mm2/s for BOTs and 1.021 × 10⁻³ mm2/s for MOTs (p = 0.0005) (Figure 3), and the median of minimum ADC value was 1.394 × 10⁻³ mm2/s for BOTs and 0.812 × 10⁻³ mm2/s for MOTs (p = 0.0006) (Figure 4), both of which were significantly lower in MOTs than that in BOTs. The cutoff value obtained from the ROC curve was 1.365 × 10⁻³ mm2/s in the average ADC value and 1.092 × 10⁻³ mm2/s in the minimum ADC value, both of which were area under the curve (AUC) 1.0 (Figures 3, 4). The correlation between the average ADC values was very strongly correlated with the correlation coefficient (r = 0.9569) of the results obtained by the two examiners; the Spearman rank correlation coefficient ρ was 1.0 (p < 0.0001) (Figure 5).
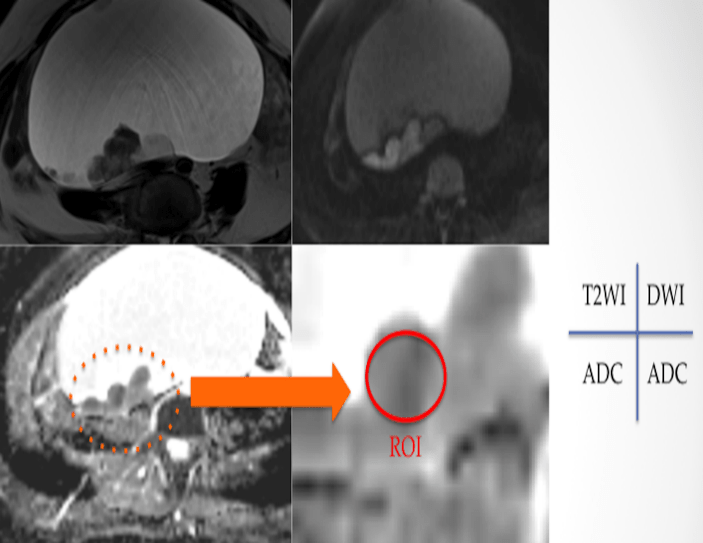
Figure 1: Setting of ROI in ADC map for solid part (≥1 cm2) of ovarian tumor.

Figure 2: Setting of ROI in ADC map for solid part (<1 cm2) of ovarian tumor.
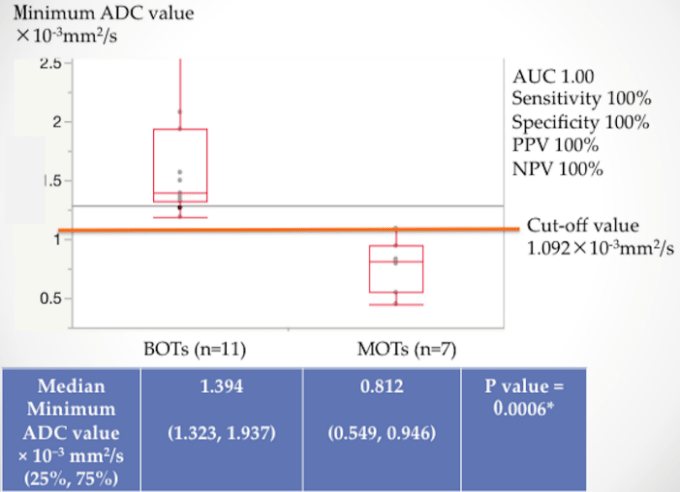
Figure 3: Median and cutoff value of average ADC.
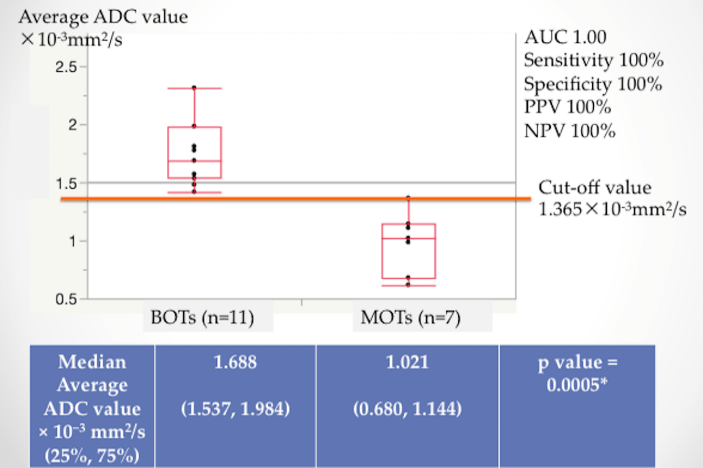
Figure 4: Median and cutoff value of minimum ADC.
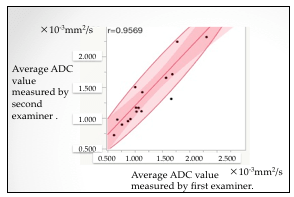
Figure 5: Correlation of the measured values of average ADC values between two examiners.
D i s c u s s i o n
Measurement of the ADC value of the solid portion or thickened wall of the ovarian tumor is useful for distinguishing between BOT and MOT. Although the average ADC value seems to be useful, the minimum ADC value is simple and useful as it only sets and measures the ROI so as to sufficiently contain the solid portion or thickened wall of the ovarian tumor.
The difference in cell density appears to be the main reason for the difference in ADC values between BOTs and MOTs. A statistically significant inverse correlation between the ADC values and tumor cellularity of pathological specimens has been shown in previous studies of prostate, breast, and kidney neoplasms [11-13]. The other reason for the difference in ADC values between BOTs and MOTs may be related to the structure of the tumors. In previous studies, papillary structure may contribute to the high ADC value of the solid component and serous surface papillary carcinoma displayed high ADC values [7, 10,14, 15]. However, because serous surface papillary carcinoma seldom occurs and quickly progresses, there should be no problem in its diagnosis [10, 15]. Furthermore, in the case of mucinous tumor, BOTs usually contain closely packed tiny cysts in the solid portion, but the water molecules diffuse with less restriction, revealing a higher ADC value [16].
In this study, we demonstrated that minimum ADC value was highly predictive for the differential diagnosis between BOTs and MOTs. Zhao et al. reported that the average ADC value of the solid part of the ovarian tumor was useful between BOTs and MOTs [7]. Subsequently, Mimura et al. demonstrated that ADC histograms of the solid tumor component can be helpful to distinguish between BOTs and MOTs, and 10th percentile ADC values appeared to be the best parameter for the differentiation of tumor types [8]. Denewar et al. reported that the minimum ADC value was useful to distinguish between BOTs and MOTs [9]. In the present study as well as the previous reports [7-9], both average and minimum ADC values were significantly lower in MOTs than that in BOTs. One of the limitations in ADC mapping for diagnosing ovarian tumors is the difficulty in evaluation due to small solid part [7]. According to Denewar et al., the minimum ADC value has higher sensitivity and specificity than the average ADC value and more accurately reflects the aggressiveness of the tumor [9]. Mimura et al. reported that the 10th percentile ADC value had the highest p value, but the minimum ADC value also showed a significant difference where its sensitivity was much higher [8]. We believe that because it is much easier to set the ROI with the suspicious solid portion or thickened wall for the minimum ADC value, it is a useful index to discriminate between BOTs and MOTs.
Previous reports demonstrated cutoff ADC values for differentiating malignant ovarian lesions. A report from Japan, using a 1.5T Siemens scanner revealed a mean ADC of (0.93 ± 0.30) × 10-3 mm2/s for MOTs [17]. Thomassin-Naggara et al., using a 1.5T Siemens scanner, reported a mean ADC of 1.14 ± 0.23 × 10⁻³ mm2/s for solid portions of MOTs [18]. Li W et al. showed that an ADC value of 1.25×10⁻³ mm2/s was associated with high sensitivity and specificity for malignant ovarian tumor, using 1.5T GE scanner ADC measurements of ROI in the solid portions resulted in a mean of 1.03 ± 0.22 × 10⁻³ mm2/s in MOTs [19]. A threshold value of 1.039 × 10⁻³ mm2/s using a 1.5T Siemens scanner was reported to permit the distinction with 97.0% sensitivity, 92.2% specificity, and 96.4% accuracy [7]. More recently, using 1.5 T Philips, Siemens, or GE scanner, or 3 T Siemens or Philips scanner, Denewar et al. revealed that a cutoff value of minimum ADC; 1.41 × 10⁻³ mm2/s for indicators of MOTs with an AUC, sensitivity, and specificity of 0.86, 81%, and 84%, respectively [9]. These cutoff values previously reported widely varied by the institutions and MRI scanners. The ADC value varies depending on the facility, MRI model, and mode [20]. Thus, it seems to be difficult to determine the universal cutoff value. It is also necessary to consider whether generalization is possible by standardizing the MRI conditions.
One of the limitations of our study is that (0, 800, 1000), (0, 600, 800), (0, 600, 1000) are included as combinations of b values this time, from the report of Ozaki et al., the influence on the ADC value is considered to be slight, but the conditions are not strictly in agreement [20]. A second limitation is that the difference was not examined by histological subtypes, although the distribution of histological subtype was uneven in both groups. Differences in ADC values due to histological types have also been reported at other primary sites [21]. Finally, although the ADC value might be a useful indicator only in cases where an epithelial borderline or malignant tumor is suspected, benign tumors were excluded in this study. Some benign tumors show reduced diffusion and it is difficult to distinguish between benign and malignant tumors in DWI [22]. Also, it should be noted that the normal ovarian parenchyma shows a decrease in diffusion.
Conclusions
The ADC value of the solid portion or thickened wall of ovarian tumor is useful to differentiate between MOT and BOT. Especially the minimum ADC value is useful in that it can easily measure the ROI so that it contains solid portion or thickened wall.
Acknowledgments
The authors would like to thank Enago (www.enago.jp) for the English language review.
Conflicts of interest
The authors declare that there is no conflict of interest regarding the publication of this paper.
Financial support:
Financial support for this study was not provided.
Article Info
Article Type
Research ArticlePublication history
Received: Mon 19, Nov 2018Accepted: Tue 04, Dec 2018
Published: Thu 13, Dec 2018
Copyright
© 2023 Yoichi Aoki. This is an open-access article distributed under the terms of the Creative Commons Attribution License, which permits unrestricted use, distribution, and reproduction in any medium, provided the original author and source are credited. Hosting by Science Repository.DOI: 10.31487/j.RDI.2018.02.001
Author Info
Corresponding Author
Yoichi AokiDepartment of Obstetrics and Gynecology, Graduate School of Medicine, University of the Ryukyus, 207 Uehara Nishihara, Okinawa 903-0215, Japan
Figures & Tables
Table 1. Characteristics of patients and MRI morphology and signal intensity of diffusion-weighted imaging of solid part or thickened wall of borderline and malignant epithelial ovarian tumors.
|
|
BOTs (n = 11) |
MOTs (n = 7) |
p value |
|
Median age (years) (range) |
40 (27–73) |
57 (35–68) |
0.1126* |
|
Histological subtype Clear cell Serous Mucinous Seromucinous Endometrioid |
0 2 8 1 0 |
6 0 0 0 1 |
< 0.0001** |
|
Median CA125 (U/ml) (range) |
26 (13—65) |
22 (9—531) |
0.4680* |
|
Mode of surgery Radical Fertility sparing |
6 5 |
6 1 |
0.4633** |
|
Median tumor diameter (mm) (range) |
195 (33—296) |
142 (55—199) |
0.5867* |
|
Morphologic pattern Cystic Mainly cystic Mixed Solid |
2 9 0 0 |
0 2 2 3 |
0.0059** |
|
Signal intensity on DWI Low Moderate High |
3 7 1 |
0 3 4 |
0.0727** |
* Wilcoxon test, ** Fisher’s exact test. DWI: diffusion-weighted imaging
Cystic: cystic including thickened wall, Mainly cystic: cystic with some papillary nodules, Mixed: cystic mixed with solid portion, Solid: Almost solid
References
1. Houck K, Nikrui N, Duska L, Chang Y, Fuller AF, et al. (2000) Borderline tumors of the ovary: correlation of frozen and permanent histopathologic diagnosis. Obstet Gynecol 95: 839-843. [Crossref]
2. Song T, Choi CH, Kim HJ, Kim MK, Kim TJ, et al. (2011) Accuracy of frozen section diagnosis of borderline ovarian tumors. Gynecol Oncol 122: 127-131. [Crossref]
3. Seidman JD, Kurman RJ (2000) Ovarian serous borderline tumors: a critical review of the literature with emphasis on prognostic indicators. Hum Pathol 31: 539-557. [Crossref]
4. Koskas M, Uzan C, Gouy S, Pautier P, Lhomme C, et al. (2011) Prognostic factors of a large retrospective series of mucinous borderline tumors of the ovary (excluding peritoneal pseudomyxoma). Ann Surg Oncol 18: 40-48. [Crossref]
5. Koutlaki N, Dimitraki M, Zervoudis S, Sofladou V, Grapsas X, et al. (2011) Conservative surgery for borderline ovarian tumors-emphasis on fertility preservation. A review. Chirurgia (Bucur) 106: 715-722. [Crossref]
6. Steffen Hauptmann, Katrin Friedrich, Raymond Redline, Stefanie Avril (2017) Ovarian borderline tumors in the 2014 WHO classification: evolving concepts and diagnostic criteria. Virchows Arch 470: 125-142. [Crossref]
7. Zhao SH, Qiang JW, Zhang GF, Ma FH, Cai SQ, et al. (2014) Diffusion-weighted MR imaging for differentiating borderline from malignant epithelial tumors of the ovary: pathological correlation. Eur Radiol 24: 2292-2299. [Crossref]
8. Mimura R, Kato F, Tha KK, Kudo K, Konno Y, et al. (2016) Comparison between borderline ovarian tumors and carcinomas using semi-automated histogram analysis of diffusion-weighted imaging: focusing on solid components. Jpn J Radiol 34: 229-237. [Crossref]
9. Denewar FA, Takeuchi M, Urano M, Kamishima Y, Kawai T, et al. (2017) Multiparametric MRI for differentiation of borderline ovarian tumors from stage I malignant epithelial ovarian tumors using multivariate logistic regression analysis. Eur J Radiol 91: 116-123. [Crossref]
10. Kim HJ, Kim JK, Cho KS (2004) CT features of serous surface papillary carcinoma of the ovary. AJR Am J Roentgenol 183: 1721-1724. [Crossref]
11. Guo Y, Cai YQ, Cai ZL, Gao YG, An NY, et al. (2002) Differentiation of clinically benign and malignant breast lesions using diffusion-weighted imaging. J Magn Reson Imaging 2002; 16: 172-178. [Crossref]
12. Gibbs P, Liney GP, Pickles MD, Zelhof B, Rodrigues G, et al. (2009) Correlation of ADC and T2 measurements with cell density in prostate cancer at 3.0 Tesla. Invest Radiol 44: 572-576. [Crossref]
13. Manenti G, Di Roma M, Mancino S, Bartolucci DA, Palmieri G, et al. (2008) Malignant renal neoplasms: correlation between ADC values and cellularity in diffusion weighted magnetic resonance imaging at 3T. Radiol Med 113: 199-213. [Crossref]
14. Outwater EK, Huang AB, Dunton CJ, Talerman A, Capuzzi DM (1997) Papillary projections in ovarian neoplasms: appearance on MRI. J Magn Reson Imaging 7: 689-695. [Crossref]
15. Gooneratne S, Sassone M, Blaustein A, Talerman A (1982) Serous surface papillary carcinoma of the ovary: a clinicopathologic study of 16 cases. Int J Gynecol Pathol 1: 258-269. [Crossref]
16. Hart WR (2005) Borderline epithelial tumors of the ovary. Mod Pathol 2: 33-50. [Crossref]
17. Fujii S, Kakite S, Nishihara K, Kanasaki Y, Harada T, et al. (2008) Diagnostic accuracy of diffusion-weighted imaging in differentiating benign from malignant ovarian lesions. J Magn Reson Imaging 28: 1149-1156. [Crossref]
18. Thomassin-Naggara I, Daraï E, Cuenod CA, Foumier L, Toussaint I, et al. (2009) Contribution of diffusion-weighted MR imaging for predicting benignity of complex adnexal masses. Eur Radiol 19: 1544-1552. [Crossref]
19. Li W, Chu C, Cui Y, Zhang P, Zhu M (2012) Diffusion-weighted MRI: a useful technique to discriminate benign versus malignant ovarian surface epithelial tumors with solid and cystic components. Abdom Imaging 37: 897-903. [Crossref]
20. Ozaki M, Ogura A, Muro I, Miyati T, Tamura T, et al. (2010) Influence of imaging parameters on the measurement of apparent diffusion coefficient. Nihon Hoshasen Gijutsu Gakkai Zasshi 66: 1178-1185. [Crossref]
21. Wen Y, Peng Y, Duan XM, Zhang N (2017) Role of diffusion-weighted imaging in distinguishing thoracoabdominal neuroblastic tumours of various histological types and differentiation grades. J Med Imaging Radiat Oncol 61: 718-724. [Crossref]
22. Kim HJ, Lee SY, Shin YR, Park CS, Kim K (2016) The Value of Diffusion-Weighted Imaging in the Differential Diagnosis of Ovarian Lesions: A Meta-Analysis. PLoS One. [Crossref]