Early Detection of Response to Radiotherapy Treatment with 11C-Acetate PET Imaging
A B S T R A C T
11C-Acetate radiotracer with Positron Emission Tomography (PET) imaging is currently used in cardiovascular imaging for perfusion and oxygen consumption measurement. It is also used, among other diseases, for prostate cancer as this radiotracer does not accumulate in the bladder. The present study reports the assessment of the radiotherapy treatment by measuring the tumor perfusion and oxygenation before and at mid-treatment by imaging with dynamic 11C-Acetate in patients with head and neck cancer. A pre-treatment dynamic 11C-Acetate and a clinical static 18F-FDG PET were conducted before initiation of the treatment, and the second 11C-Acetate dynamic scan was performed after four weeks of radiotherapy (i.e., after a dose of 35 Gy for a total of 70 Gy). The two-tissue compartment model was applied to 11C-Acetate images to extract the perfusion and oxygen consumption. The results showed a reduction in tumor volume by more than 50% compared to the initial volume in patient-1. Besides, patient-2 has displayed a more reduced tumor volume after 4 weeks of treatment. The 11C-Acetate rate constant k2 representing oxygen consumption increased after radiotherapy dose in both patients. This increase of k2 could reflect the reoxygenation process inside the tumor, and it can reflect the early treatment response. In conclusion, 11C-Acetate could predict the early changes in the tumor perfusion and the oxidative metabolism to optimally adjust the treatment.
Keywords
Radiotherapy, cancer, positron emission tomography, 11C-acetate, kinetic modeling
Introduction
Positron Emission Tomography (PET) uses various metabolic tracers in nuclear medicine imaging. 18F-fluorodeoxyglucose (18F-FDG) is the most popular pharmaceutical in PET imaging, which has several applications in nuclear medicine, extending from oncology studies to perfusion measurements [1]. However, 18F-FDG has some disadvantages in some cases, such as in differentiating some neoplasms, detecting hypoxia and urinary tract malignancy [2, 3]. Therefore, new pharmaceuticals have been developed to overcome these drawbacks. Among these new tracers, 11C-Acetate has a promising role in PET studies [4].
Biologically, 11C-Acetate has two different metabolic pathways: anabolic and catabolic. Anabolic metabolism involves the synthesizing of cholesterol and fatty acids, or acetate can be oxidized as catabolic pathways in mitochondria. The dominant pathways would depend on the type of cells [5, 6]. Catabolic pathways are used in myocardial tissues for oxidization. On the other hand, anabolic pathways appeared mainly in tumor cells. Tumor cells expressed the enzyme acid-synthetase, which converts most of the acetate to fatty acids. Schiepers et al.'s study confirmed that the catabolic pathway could happen as well in tumor cells in the first 20 minutes [7]. 11C-Acetate has been performed in several PET studies such as prostate cancer, hepatocellular carcinoma, myocardial oxygen consumption, renal cell carcinoma, and brain tumors [8].
The earlier analysis techniques of 11C-Acetate images were mainly based on the type of acquisition. A comparison of 11C-Acetate images with 18F-FDG was usually made using the standard uptake value (SUV). In dynamic imaging, compartmental modeling using various models was applied, such as a single tissue compartment to calculate the perfusion index and the oxidative component Kmono, or a two-tissue compartment using first-order differential equations [9, 10]. NG et al. described a 6-compartment model for 11C-Acetate used to estimate the myocardial oxidative metabolism, while Regula et al. applied two-tissue compartments with 11C-Acetate for prostate cancer to measure its aggressiveness [11, 12]. In head and neck cancer (HNC), Sun et al. used an exponential fitting curve to calculate the Kmono to express the tumor oxidative metabolism [9]. The present study investigates the early response of HNC to radiotherapy treatment using dynamic 11C-Acetate.
Materials and Methods
I Patients
Two patients histologically diagnosed with squamous cell carcinoma in the base of the tongue with positive human papillomavirus (HPV) were studied. Both patients scanned twice with 11C-Acetate PET/CT: one initial pre-treatment and the second 4 weeks later, after 35 Gy of radiotherapy dose on a total of 70 Gy on 7 weeks. The ethical committee approved the research study, and both patients signed written informed consent for these images.
II PET Scan
Four 30 min dynamic scans of 11C-Acetate were acquired with a CT/PET system (Philips Gemini TF 16). The injected activity was 4 MBq/kg. The time frames were: 12 x 5s, 6 x 10s, 4 x 30s, 3 x 120s, and 4 x 300s. The image-derived arterial input function (IDIF) was estimated for each patient from the carotid artery sagittal images. Besides, a standard clinical protocol 18F-FDG PET imaging was performed before the start of treatment to be compared to another 18F-FDG scan 6 months after treatment. The images of each patient before and at mid-treatment were co-registered based on their respective CT images. Regions of interest (ROIs) were manually drawn on the tumors on the pre-treatment images then copied to the other dynamic image sequence.
III Compartmental Modeling
The two-tissue compartment model was used in this study to describe the kinetics of 11C-Acetate in HNC tumors (1) [10].
𝐶𝑃𝐸𝑇(𝑡) = [𝐴1𝑒−(𝑘2+𝑘3)𝑡+𝐴2]⨂𝐶𝑏(𝑡)+𝜈𝐶𝑏(𝑡) (1)
\[A_1=\frac{K_1k_2}{k_2+k_3};\]
\[A_2=\frac{K_1k_3}{k_2+k_3};\]
Where K1 is the perfusion, k2 is the reflux factor, k3 is the uptake factor, vCb(t) is the tissue blood volume and Cb(t) is the blood input function.
Results
Figure 1 shows the initial 18F-FDG image, two images from the sets of dynamic 11C-Acetate images (initial and mid-treatment), and the time-activity curves (TAC) of the tumor from 11C-Acetate images. There was a noticeable decrease in tumor volume after 35 Gy of radiotherapy dose (Figures 1b and 1c). The tumor had more than 50% reduction in tumor volume. Moreover, the behaviour of the time-activity curves (Figure 1d), which is an indicator of tumor oxygenation, appeared with different shapes. The results of the second patient are presented in (Figure 2).

Figure 1: Images for patient-1. a) 18F-FDG image of the tumor in the base of the tongue. b) The corresponding initial 11C-Acetate image. c) The mid-radiotherapy 11C-Acetate image (at 35 Gy dose). d) Time-activity curves of the tumor in images b and c.
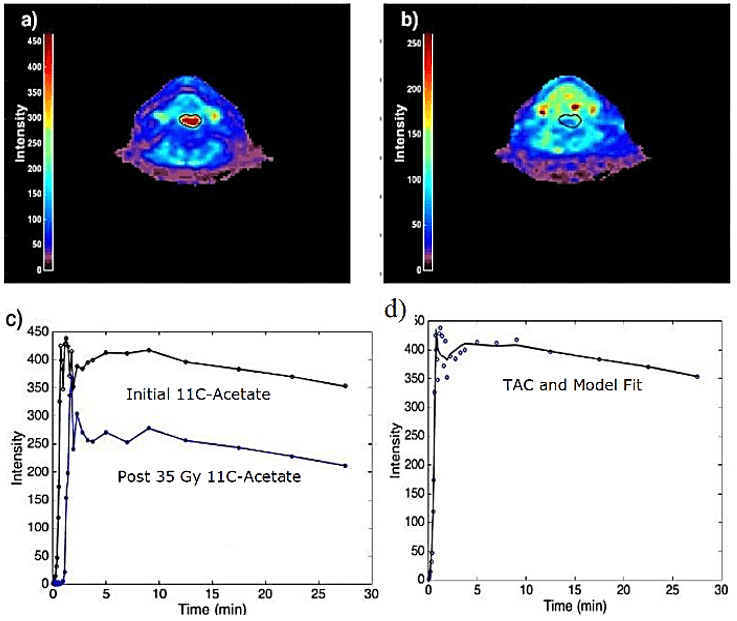
Figure 2: Images for patient-2. a) Initial 11C-Acetate image. b) The corresponding mid-radiotherapy 11C-Acetate image. c) TACs for 11C-Acetate at pre- and at mid-treatment. d) Tumor TAC and compartmental fit.
The tumor was clearly non-apparent after 35 Gy of radiotherapy dose. Table 1 shows the compartmental modeling results for the two patients. The parameter k2 has been increased after 35 Gy radiotherapy dose mainly in patient-1, while it very slightly increased in patient-2. k2 reflects the increasing oxidative metabolism in the tumor. Besides, the perfusion K1 parameter was increased after the radiotherapy dose in patient-1, while it was lowered in patient-2. The increase in K1 parameter could be explained as a more efficient oxygen supply to the tumor after radiotherapy dose (reoxygenation effect), and the lowering K1 might refer to the hypoxia induced by the radiation. The discrepancy between the positive response of the tumor or, on the contrary, the radiation-induced hypoxia in patient-2, will be clarified when taking the follow-up scan of 18F-FDG six months after the end of the treatment. It is worth mentioning that hypoxia is usually measured with 18F-FMISO, but 11C-Acetate is the reverse; it measures the perfusion in the tumor. The SUV also indicated an increase in patient-1 while the value in patient-2 was almost unchanged.
Table
1:
Compartmental modeling parameters.
|
Patient-1 |
Patient-2 |
|||
|
Parameter |
Initial 11C- Acetate |
Post 35 Gy 11C- Acetate |
Initial 11C- Acetate |
Post 35 Gy 11C- Acetate |
|
K1 |
0.0368 |
0.0516 |
0.0575 |
0.0111 |
|
k2 |
0.1858 |
0.5654 |
0.1444 |
0.1642 |
|
k3 |
0.0075 |
0.0235 |
0.0062 |
0.0089 |
|
SUV |
0.76 |
3.49 |
1.40 |
1.42 |
Discussion
We studied the role of 11C-Acetate imaging in the early response of a tumor to treatment. In the case of dynamic 11C-Acetate imaging, different compartmental modeling has been used to assess the kinetics of 11C-Acetate in HNC. In this study, we used the two-tissues compartment model for explaining the kinetics of 11C-Acetate in HNC. A low value of K1 indicates a hypoxic state inside the tumor. In patient-1, k2 value increased after treatment, which can be explained as an efficient blood supply to the tumor due to radiotherapy treatment. This process could lead to further oxygen metabolism inside the tumor. In patient-2, a small increase in k2 with a higher reduction in K1 value after treatment probably indicated the hypoxic state produced by the radiation inside the tumor. The same pattern is reflected by the values of SUV.
Conclusion
In this study, we showed an example of two patients imaged with 11C-Acetate prior and after 35 Gy of radiotherapy. We found that the results of compartmental modeling can explain the metabolism of 11C-Acetate in comparison with static acquisition quantitative techniques. Perfusion and oxidative rate can be estimated using this model. Dynamic 11C-Acetate scans and appropriate analysis can be used to investigate the early tumor response to radiotherapy treatment.
Ethical Approval
The ethical committee approved the research study.
Consent
Both patients signed written informed consent for these images.
