Effect of Gplife Advance Diabetic Support on Time in Range in Type 2 Diabetes Mellitus Patients: A Case Report
A B S T R A C T
This case report documents 20 patients suffering from uncontrolled type 2 diabetes mellitus, presenting complaints of fluctuating blood glucose levels. The parameters like fasting and postprandial blood glucose, HbA1c and C- peptide levels of patients were evaluated. These patients were then advised an adjuvant therapy of Gplife advanced diabetic support tablets along with their daily insulin injections. After 60 days of treatment, the therapy was discontinued, and patients were subjected to continuous glucose monitoring for 8 days and time in range (TIR) percentage was calculated. Also, the fasting and postprandial blood glucose, HbA1c and C-peptide levels were estimated. The average TIR percentage was found to be 93.2%, whereas the time above range (TAR) and time below range (TBR) was 6.8 % and 0 % respectively, which indicates that the patients had a negligible incidence of hyper and hypoglycemia after 60 days of treatment. There was a significant decrease by 61 % in HbA1c levels, 40.05 % in fasting blood glucose levels and 34.29 % in postprandial blood glucose levels (p<0.001). C-peptide levels increased by 1.38 folds after 60 days of treatment. Also, there were no evidence of diabetic comorbidities. Thus, indicating a marked improvement in the diabetic condition and overall quality of life in patients.
Keywords
Time in range (TIR), adjuvant therapy, type 2 diabetes mellitus, anti-diabetic
Introduction
According to WHO, diabetes is described as a metabolic disorder that is characterized by the presence of hyperglycemia. Patients suffer from diabetes due to many reasons, including resistance of the body to utilize the insulin produced (T2DM) and insufficient insulin production due to autoimmune pancreatic beta cell destruction (T1DM) [1]. If diabetes is not controlled for a chronic duration, it can lead to various concomitant conditions like cardiovascular complications, stroke, irreversible degenerative damage to eyes and kidneys, etc. [2, 3]. According to the American diabetic association, time in range (TIR) is a metric scale that denotes the amount of time in terms of percentage that a person’s glucose levels remain within the recommended range 70- 180 mg/dl or 63-140 mg/dl in pregnancy. The concept of TIR was brought into consideration by the international plane of diabetic experts to discover a better and reliable parameter apart from HbA1c to monitor the effectiveness of diabetic medications. International consensus on time-in-range was introduced few years back; according to this, TIR can be considered as the important continuous glucose monitoring (CGM) derived metric which defines a better overlook to the short-term glycemic control than HbA1c [4].
There are specific target ranges for different populations like older or high-risk individuals and pregnancy. Although the glucose requirement for each individual is different, according to the ranges for the generalized category, the type 1 or type 2 individuals should spend more than 70 %, which is approximately 17 hrs of a day in the target range (70-180 mg/dl). While more than 50 % (≥ 12 hrs ) is recommended for older and high-risk type 2 patients. Also, the individual should spend no more than 25 % (< 6 hrs ) in glucose levels higher than 180 mg/dl, should not have glucose levels below 70 mg/dl for more than 4 % (58 mins) and below 54 mg/dl for more than 1% (14 mins) in a day. The effective antidiabetic medicine should always aim to increase TIR while reducing both time above range (TAR) and time below range (TBR) [5].
HbA1c analysis is considered a gold standard to estimate glycemic control. However, it is influenced by various factors other than glucose concentration; thus, exact interpretation of glycemic control is difficult. According to established data, patients with similar HbA1c have shown considerable differences in their glucose profiles. Also, HbA1c fails to indicate glycemic variability i.e., incidence of hyper and hypoglycemia which can be easily estimated using CGM and TIR monitoring [6]. Such incidences are often associated with micro-and macro-vascular complications in diabetes. Thus, TIR is considered a better parameter to assess the effectiveness of anti-diabetic medications in terms of evaluating the glycemic variability.
Gplife advanced diabetic support is a phyto complex containing the key ingredients of standardized and fortified extract of Gymnema sylvestre, Curcuma longa, Tinospora cordifolia, Garcinia cambogia, Trigonella foenum-Graecum, Coffea arabica, Enicostemma littorale, Bacopa monnieri, Eugenia jambolana, Plantago ovata, Withania somnifera, Panax Ginseng, Cinnamomum verum, Andrographis paniculata, etc. It is formulated in the form of tablets for ease in administration to diabetic people and increases its palatability. All these plants have a proven anti-diabetic property [7, 8].
Case Report
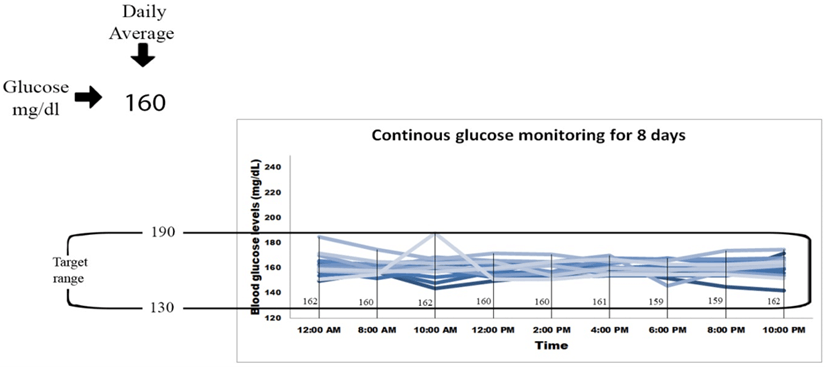
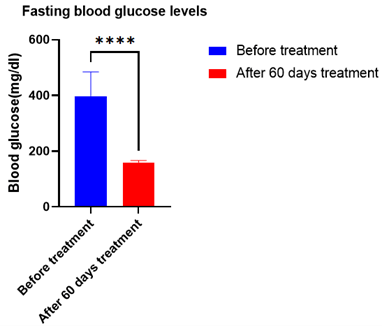
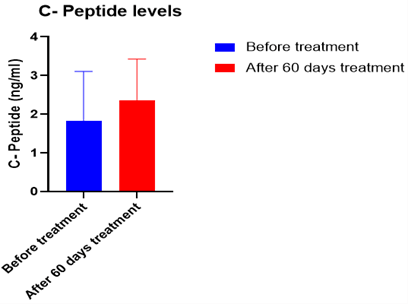
Twenty patient’s including 14 males and 6 females, with an average age of 50 years, had a known history of type 2 diabetes mellitus. During consultation, they complained about uncontrolled diabetes and fluctuating blood glucose levels. They were on the therapy of general oral hypoglycemic drugs for a long duration. They had average fasting blood glucose levels of 397 mg/dl and average postprandial blood glucose levels of 459 mg/dl. The mean HbA1c levels of these patients were found to be 12.3 %. Also, the average C-Peptide levels of 20 patients were found to be 1.8 ng/ml. All these patients were then advised to take their regular insulin supplement in divided doses everyday along with the adjuvant therapy of Gplife advance diabetic support, an oral hypoglycemic agent. After giving the treatment for 60 days, the drug was discontinued. After which CGM was done for next 8 days. The blood glucose levels were estimated at the time points of 12 AM, 8 AM, 10 AM, 12 PM, 2 PM, 4 PM, 6 PM, 8 PM and 10 PM to estimate the glycemic variability throughout the day (Figure 1).
Figure 1: Continuous glucose monitoring for 8 days.
The fasting blood glucose levels decreased significantly by 40.05 % (Figure 2), whereas the postprandial blood glucose levels decreased significantly by 34.29 % (Figure 3) (p<0.0001). The target range was kept as 120-180 mg/dl. According to this target, the average time in range was found to be 93%, TAR level 1 (above 180-250 mg/dl) was found to be 7%, whereas TAR level 2 (above 250-400 mg/dl), TBR level 1 (below 54-69 mg/dl) and TBR level 2 (below 54 mg/dl) was found to be 0% (Figure 6). The HbA1c levels were found to be significantly reduced by 61 % after the treatment (p<0.0001) (Figure 4) and C peptide levels were also increased by 1.38 folds (Figure 5), indicating overall better glycemic control (Table 1).
Figure 2: Average Fasting blood glucose levels of 20 patients after 60 days of treatment with Gplife advance diabetic support. Data analyzed by t- test (graphpad prism 9.2.) [**** - denotes significant (p<0.0001) difference compared before treatment].
Figure 3: Average Postprandial blood glucose levels of 20 patients after 60 days of treatment with Gplife advance diabetic support. Data analyzed by t- test (graphpad prism 9.2.) [**** - denotes significant (p<0.0001) difference compared before treatment].
Figure 4: Average HbA1c levels of 20 patients after 60 days of treatment with Gplife advance diabetic support. Data analyzed by t- test (graphpad prism 9.2.) [**** - denotes significant (p<0.0001) difference compared before treatment].
Figure 5: Average C- peptide levels of 20 patients after 60 days of treatment with Gplife advance diabetic support.
Figure 6: Time in range (TIR) percentage after 60 days of treatment.
Table 1: Estimation of diabetic parameters after the treatment
of 60 days.
|
After 60 days of Treatment (CGM -8 days analysis) |
||||||||||
|
TIR
(125-180 mg/dl) |
Level -1 TAR (180-250 mg/dl) |
Level-2 TAR (250-400 mg/dl) |
Level -1 TBR (54-69 mg/dl) |
Level-2 TBR (< 54 mg/dl) |
Retinopathy |
Neuropathy |
Microalbumenia |
HBA1C |
C Peptide |
|
|
93 |
7 |
0 |
0 |
0 |
NO |
NO |
NO |
7.6 |
2.3 |
|
Discussion
Diabetes is characterized by high blood glucose levels. American diabetic association introduced time in range (TIR) as an evaluation parameter to estimate the effectiveness of antidiabetic therapy in terms of controlling blood glucose levels. Time in range (TIR) is a metric scale which denotes the amount of time in terms of percentage that a person’s glucose levels remains within the recommended range. The continuous elevated blood glucose can give rise to various comorbidities like cardiovascular disorders, retinopathy, nephropathy, neuropathy etc. Thus, it is very necessary to have prominent control over glycemic status. Evaluation of TIR can be used to predict the future risk of diabetes complications. The percentage of time spent by the patient outside the range i.e., Time above range (TAR) and time below range (TBR), greatly influence the possibility of developing various microvascular complications associated with diabetes.
The Gplife advanced diabetic support medicine is a combination of various phytomedicines which act in synergistic way to lower the blood glucose levels in diabetic subjects. The above mentioned treatment not only helps to reduce the blood glucose levels but also there is marked decrease in blood glucose fluctuation throughout the day which can be seen by increase in the TIR percentage to 93%. Also, the treatment has prominently reduced the TAR and TBR percentage to 7 and 0 % respectively, which helps the patient to maintain constant healthy blood glucose levels and prevent from extreme episodes of hypo or hyperglycemia. Thereby increasing the quality of life of patient and provide better protection from future diabetic comorbidities. Also, there is an increase in C-peptide levels, which is indicative of an increase in insulin production, which aids to lower the hyperglycemic levels in the patient. Further, there were no indications of the development of retinopathy, neuropathy and microalbumenia, which is the advantage of this treatment.
Conflicts of Interest
Dr. Shridhar Pandya and Dr. Chetan Savaliya, are directors in GPlife Healthcare Pvt. Ltd. The authors declare that they don’t have competing interests.
Funding
None.
Acknowledgement
The authors would like to acknowledge the research team and the back-office team involved in the research work. We would like to acknowledge the support from all study site staffs, investigators and back-office team.
Article Info
Article Type
Case ReportPublication history
Received: Mon 31, Oct 2022Accepted: Mon 12, Dec 2022
Published: Fri 13, Jan 2023
Copyright
© 2023 Shridhar Pandya. This is an open-access article distributed under the terms of the Creative Commons Attribution License, which permits unrestricted use, distribution, and reproduction in any medium, provided the original author and source are credited. Hosting by Science Repository.DOI: 10.31487/j.JDMC.2022.01.02
Author Info
Shridhar Pandya Chetan Savaliya
Corresponding Author
Shridhar PandyaDirector, Gplife Healthcare Pvt Ltd, Surat, India
Figures & Tables
Table 1: Estimation of diabetic parameters after the treatment
of 60 days.
|
After 60 days of Treatment (CGM -8 days analysis) |
||||||||||
|
TIR
(125-180 mg/dl) |
Level -1 TAR (180-250 mg/dl) |
Level-2 TAR (250-400 mg/dl) |
Level -1 TBR (54-69 mg/dl) |
Level-2 TBR (< 54 mg/dl) |
Retinopathy |
Neuropathy |
Microalbumenia |
HBA1C |
C Peptide |
|
|
93 |
7 |
0 |
0 |
0 |
NO |
NO |
NO |
7.6 |
2.3 |
|


References
1. Kazi AA, Blonde L
(2001) Classification of diabetes mellitus. Clin Labo Med 21: 1-13. [Crossref]
2. Zulu C, Zulu B
(2021) A Case Study on Mrs E.C. with Diabetes Mellitus. Nur Primary Care
5: 1-4.
3. Long AN, Dagogo
Jack S (2011) Comorbidities of diabetes and hypertension: mechanisms and
approach to target organ protection. J Clin Hypertens 13: 244-251. [Crossref]
4. Battelino T, Danne
T, Bergenstal RM, Amiel SA, Beck R et al. (2019) Clinical Targets for
Continuous Glucose Monitoring Data Interpretation: Recommendations From the
International Consensus on Time in Range. Diabetes Care 42: 1593-1603. [Crossref]
5. Saboo B, Kesavadev
J, Shankar A, Krishna MB, Sheth S et al. (2021) Time-in-range as a target in
type 2 diabetes: An urgent need. Heliyon 7: e05967. [Crossref]
6. Lu J, Lu X, Ma X,
Zhou J, Zhang L et al. (2018) Association of Time in Range , as Assessed by
Continuous Glucose Monitoring , With Diabetic Retinopathy in Type 2 Diabetes. Diabetes
Care 41: 2370-2377. [Crossref]
7. Pivari F, Mingione A, Brasacchio C, Soldati L (1950) Curcumin and Type 2 Diabetes Mellitus: Prevention and Treatment. J R Soc Promot Health 70: 204-208.
8. Tiwari P, Mishra BN, Sangwan NS (2014) Phytochemical and pharmacological properties of Gymnema sylvestre: an important medicinal plant. Biomed Res Int 2014: 830285. [Crossref]
