Journals
Hamigeran G Does Not Affect Golgi Structure or Function in HEK293 Cells
A B S T R A C T
The hamigerans are diterpenoid secondary metabolites isolated from the New Zealand marine sponge Hamigera tarangaensis. Of all the hamigerans that have been isolated and characterised at Victoria University of Wellington, hamigeran G showed the most potent anti-proliferative activity against a mammalian cancer cell line. We previously reported that it might be targeting the Golgi network of cells based on a chemical genomic screen on yeast (Saccharomyces cerevisiae). Here, we investigated the effects of hamigeran G on the Golgi network of mammalian cells and showed that it did not have a significant effect on Golgi apparatus morphology or Golgi network functions such as protein secretion and endocytosis. Results of this study, therefore, conclude that the Golgi network is unlikely to be the primary target of hamigeran G's anti-proliferative activity. Further work is needed to fully elucidate the mechanism of action and target(s) of hamigeran G.
Keywords
Hamigeran G, golgi Function, vesicle Transport, brefeldin A
Introduction
Marine life is a rich source of novel classes of compounds. Marine sponges, for example, have been a dominant source of newly discovered bioactive natural products, with 224 new compounds reported in 2016 [1]. These compounds show a wide range of chemical diversity and biological activity, and hence show great potential for therapeutic use [2]. One such example is the hamigerans. The hamigerans are structurally related diterpenoid secondary metabolites that were first isolated from the New Zealand marine sponge, Hamigera tarangaensis (Bergquist and Fromont, 1988). Currently, 34 naturally occurring hamigerans have been reported [3-7]. These compounds show a range of biological activity that includes anticancer, antibacterial, antifungal, and antiviral activity. Researchers at Victoria University of Wellington were responsible for isolating 26 of the 34 different hamigerans, and of these 26, hamigeran G showed the most potential as an anticancer drug and therefore, was chosen for further research. The hamigerans were tested for anti-proliferative activity against the HL-60 human promyelocytic leukemia cell line, and hamigeran G was found to be the most cytotoxic, with an IC50 in the low micromolar range [5]. Initial studies in our laboratory on cell cycle effects demonstrated only slight accumulation of cells in G2/M of the cell cycle, making it unlikely that hamigeran G was targeting the cytoskeleton as an antimitotic agent.
To identify a possible mechanism of action or target(s) of hamigeran G’s anti-proliferative activity, a chemical genetic screen involving haploinsufficiency profiling was carried out on Saccharomyces cerevisiae [5, 8]. The screen identified three mitochondrial genes (CYC1, HMF1, and FLC3) as possible targets. In a preliminary study, hamigeran G was tested on wildtype HL-60 and mitochondrial gene knockout HL-60 cells (HL-60º0). We found that there was only a two-fold increase in IC50 for HL-60º0 compared to that of the wildtype HL-60 [5]. This increase in resistance to hamigeran G is relatively small and indicates that the mitochondrion is unlikely to be the primary target of hamigeran G and therefore, other target(s) of hamigeran G must exist in the cell.
In addition to the mitochondria-related hits, haploinsufficiency profiling also identified 13 significant gene hits involved in Golgi apparatus and vesicular transport, of which nine were also identified in a homozygous deletion profiling screen reported to identify friends of the target that can buffer the effect of the drug [5, 8]. The 13 Golgi-related gene hits were SNC1, SFT2, ARL1, GET3, SEC22, GYP1, RUD3, COG7, COG8, COG6, COG5, GOS1, and SYS1. Description of the genes and corresponding protein functions are given in Online Resource 1. Based on these gene hits, we had previously reported that hamigeran G may be targeting the Golgi network of the cell [5]. Herein, we investigated the effects of hamigeran G on the Golgi apparatus in mammalian cells, specifically investigating Golgi structure, endocytosis, and protein secretion.
Materials and Methods
I Cell culture conditions
HEK293 (human embryonic kidney) cells, RAW264.7 (murine macrophage), and HeLa (cervical cancer) cells were grown in Dulbecco’s Modified Eagle Medium (DMEM), HepG2 (human liver carcinoma) cells in Iscove’s Modified Dulbecco’s Medium (IMDM), and HL-60 (human promyelocytic leukemia) cells in RPMI-1640 Medium. All media were supplemented with 10% foetal bovine serum (FBS) and 1% penicillin/streptomycin® (Life Technologies, NZ). Cultures were maintained at 37°C with 5% CO2 in air.
II Cell proliferation assay (MTT)
Cells (1 × 10⁴ cells/well) were seeded into a 96-well culture plate, allowed to adhere overnight, then incubated in the presence of different concentrations of hamigeran G or vehicle control (DMSO). Cell proliferation was assessed using the 3-(4,5-dimethylthiazol-2-yl)-2,5-diphenoyltetrazolium bromide (MTT) assay as previously described [9].
III Fluorescence imaging of endocytosis of red dextran
For fixed-cell imaging, HEK293 cells grown on glass coverslips were treated with hamigeran G or vehicle control (DMSO). The medium containing the drug was then aspirated off and replaced by the staining solution. The stain pHrodo® Red Dextran for endocytosis (Molecular Probes) was used according to the manufacturer’s instructions, after which, the cells were fixed with 4% paraformaldehyde. The coverslips were mounted on glass slides using Prolong® Gold Anti-fade with DAPI (Invitrogen, Australia).
For live-cell imaging, cells grown on a 35 cm diameter glass-bottom dish (FluoroDishTM) were treated with hamigeran G for 1 h, after which, the nuclei were stained with Hoechst 33342 (ImmunoChemistry Technologies, LLC) (1:1000 dilution) for 10 min. Time 0 denotes the time that pHrodo® Red Dextran stain was added. Conditions during imaging were maintained at 37°C with 5% CO2 in air. The cells were viewed in an Olympus Fluoview FV1000 confocal laser scanning microscope (Olympus Corporation, Shinjuku, Tokyo, Japan) using a 100× oil-immersion objective.
IV Immunocytochemistry for α-mannisidase, a Golgi marker
HeLa cells grown on glass coverslips were treated with hamigeran G, brefeldin A (positive control), and vehicle control (DMSO). The cells were fixed with ice-cold methanol for 10 min. All washing was performed three times with PBS-T (0.1% Triton X-100 in PBS) in between each of the following steps. The fixed cells were blocked from non-specific antibody binding using 5% BSA in PBS-T for 30 min at room temperature. Immunocytochemistry was performed using the following antibodies: rabbit IgG anti-mannosidase II (1:250) as primary antibody and goat anti-rabbit IgG Alexa Fluor® 647 (1:500) as secondary antibody. Following blocking, the cells were incubated overnight at 4°C in the primary antibody diluted in 2.5% FBS in PBS-T, then for 1 h at room temperature with the secondary antibody diluted in 5% bovine serum albumin (BSA) in PBS-T. The coverslips were mounted onto glass slides using Prolong® Gold Anti-Fade with DAPI. The slides were viewed in an Olympus Fluoview FV1000 confocal laser scanning microscope using a 100× oil-immersion objective.
V ELISA for IL-6 secretion
RAW264.7 cells were seeded into a 96-well plate at a density of 5 ×10⁴ cells/well. IFN at a final concentration of 60 units/mL was added to prime the cells, and the cells were incubated at 37°C for 18 h. Hamigeran G, brefeldin A (positive control), or vehicle control (DMSO) was added at varying concentrations. After a 24-h incubation at 37°C, the supernatants were harvested, and the cells on the plate were subjected to an MTT assay. IL-6 levels in the culture supernatants were assessed by a sandwich enzyme-linked immunosorbent assay (ELISA). Matched antibody pairs and standards were purchased from BD Pharmigen® and were used according to the manufacturer’s instructions. Results were reported as percentage change relative to the vehicle control.
VI Statistical analysis
Statistical analyses were carried out using GraphPad Prism 7. The statistical significance between treated and control groups was assessed by the Student’s unpaired t-test.
Results, Discussion and Conclusions
I Anti-proliferative activity of hamigeran G
The MTT assay was performed to investigate the anti-proliferative activity of hamigeran G. Hamigeran G inhibited proliferation of HepG2 with an IC50 of 14.8 ± 2.8 µM, 7.8 ± 1.1 µM for HL-60, 21.7 ± 1.2 µM for HEK293, 22.8 ± 1.3 µM for HeLa, and 16.7 ± 1.2 µM for RAW264.7. The concentration-response curves are shown in Figure 1. Hamigeran G shows micromolar range anti-proliferative activity against normal (HEK293 and RAW264.7) and cancer (HL-60, HepG2, and HeLa) cell lines, with HL-60 cells being the most sensitive to hamigeran G.
II Hamigeran G effect on endocytosis
The chemical genomic screen resulted in gene hits associated with the endocytosis pathway, including genes involved in vesicle-mediated transport and vesicle fusion. To validate the gene hits, an endocytosis-specific stain was used to visualise the endocytosis pathway. pHrodo Red Dextran is a cell impermeable stain that can only be internalised via endocytosis. It is pH sensitive with fluorescence emission that increases as pH decreases. Therefore, red dextran can monitor the formation and maturation of endosomes inside the cells, as pH decreases during the endocytosis process going from the early endosome to a lysosome [10].
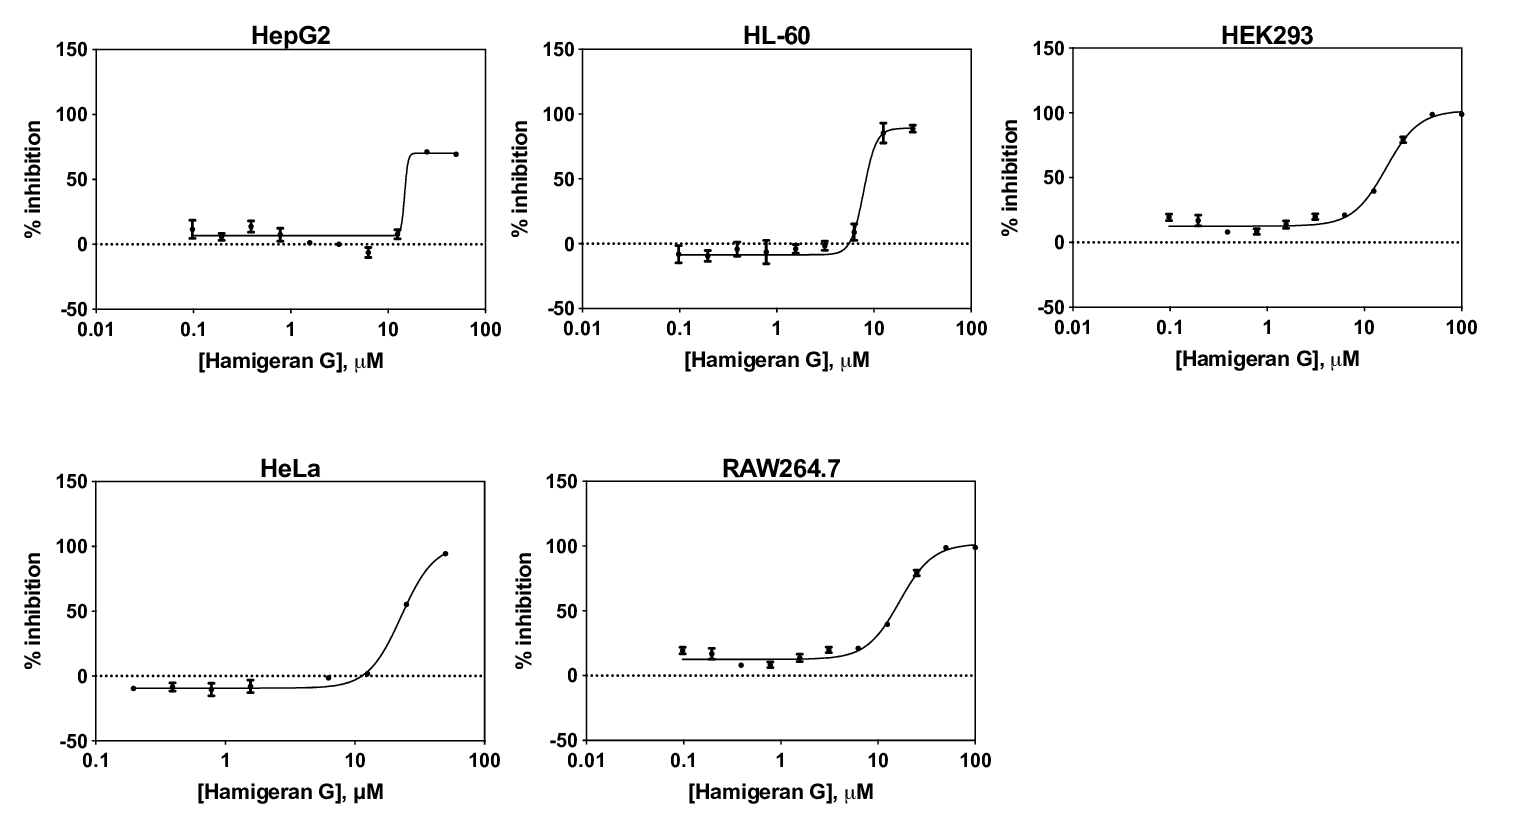
Figure 1: Hamigeran G concentration-response curves for different cell lines. The % inhibition was calculated relative to vehicle control. The graphs show mean ± SD, n=3 independent experiments
Cells pre-treated with 45 µM hamigeran G for 6 h (Figure 2b) did not result in any noticeable difference in red dextran uptake compared to the vehicle control (Figure 2a). Different stages of the endocytosis process can be observed as evidenced by different stain intensities: early endosomes, lysosomes, and fused lysosomes. The concentration was then increased to 100 µM for 1 h (Figure 2c). Again, there was no observable difference to the staining compared to the control. This cytotoxic dose, however, resulted in some of the cells undergoing apoptosis, as evidenced by fragmented nuclear material. These results suggest that hamigeran G is not directly targeting the endocytic pathway as uptake was unaffected even at cytotoxic doses of hamigeran G.
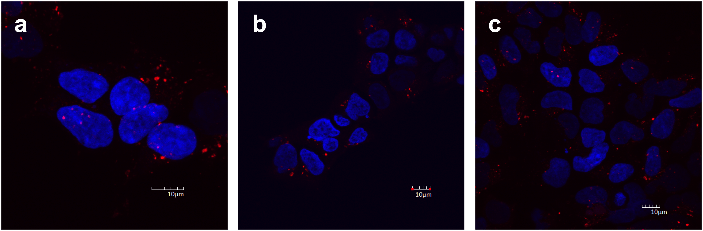
Figure 2: Vesicle staining of HEK293 cells using pHrodo® red Dextran. Cells were treated with: a. 0.1% DMSO for 6 h (vehicle control), b. 45 µM hamigeran G for 6 h, or c. 100 µM hamigeran G for 1 h. Intracellular vesicles that have taken up the red dextran fluoresce red; nuclei fluoresce blue (DAPI stain). Images shown are representative of three independent experiments. Scale bar corresponds to 10 μm
It is possible, however, that the effects of hamigeran G are reversible, as the cells were treated with hamigeran G, washed, then stained. Therefore, we performed live cell imaging of red dextran uptake in the presence of hamigeran G. Cells were treated with 100 µM hamigeran G for 1 h, then the red dextran was added. Images are shown in Figure 3. Similar to fixed cell staining, endocytosis was not inhibited even at a cytotoxic dose of hamigeran G. Therefore, the gene hits associated with the endocytotic pathway can be excluded as endocytosis was unlikely to be the primary target of hamigeran G.
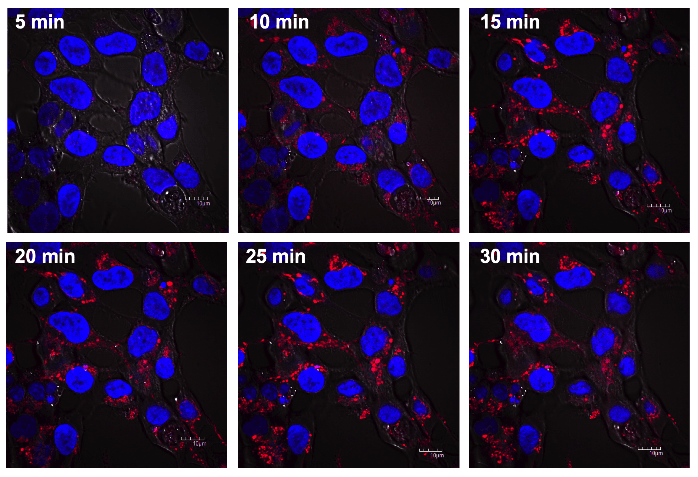
Figure 3: Time course imaging of endocytosis of red dextran during treatment with 100 µM hamigeran G. Live cells were treated with hamigeran G for 1 h, then red dextran was added at 0 min, and cells imaged at the times indicated. Scale bar corresponds to 10 μm
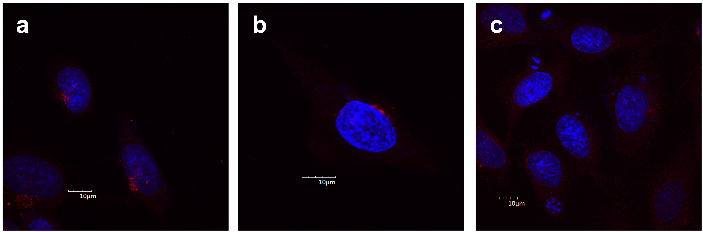
Figure 4: α-Mannosidase II as a Golgi marker (red) in HeLa cells. Nuclei are stained with DAPI (blue). Cells were treated with: a. 0.1% DMSO (vehicle control), b. 100 µM hamigeran G for 1 h, or c. 20 μM brefeldin A for 1 h (positive control for Golgi disruption). Images shown are representative of three independent experiments. Scale bar corresponds to 10 μm
III Hamigeran G effect on Golgi structure
Some of the gene hits identified in the chemical genomic screen, specifically the four COG genes, are required for normal Golgi morphology and structural organization [11]. Therefore, we investigated the effect of hamigeran G on the Golgi apparatus. The Golgi was visualized in HeLa cells using immunocytochemistry of the enzyme α-mannosidase II. α-Mannosidase II is an enzyme primarily localised in the Golgi apparatus; thus, any disruption or dispersal of α-mannosidase II would indicate Golgi disruption or disassembly [12]. As a positive control, cells were treated for 1 h with 20 µM brefeldin A, a drug known to disrupt the Golgi apparatus [13]. As shown in Figure 4c the mannosidase II staining was dispersed throughout the cytoplasm following treatment with brefeldin A, indicating Golgi dispersion consistent with previous studies [12, 14]. Treatment with 100 µM hamigeran G for 1 h (Figure 4b), on the other hand, did not result in any observable difference compared to the control as cells had localised mannosidase II staining in the vicinity of the nucleus where the Golgi apparatus is located, similar to the vehicle control (Figure 4a). From these results, it was concluded that hamigeran G was unlikely to be disrupting Golgi structure.
IV Effect of hamigeran G on IL-6 secretion
Exocytosis is one of the major process’s dependent on the Golgi network. An example of exocytosis is the secretion of proteins, such as cytokines, from the cell. The chemical genomic screen resulted in nine gene hits associated with this pathway, including transport from the endoplasmic reticulum to the Golgi, intra-Golgi transport, and transport from the Golgi to the plasma membrane. To investigate the effects of hamigeran G on the exocytosis pathway, we looked at macrophage secretion of cytokine IL-6 using ELISA to quantitate the cytokine released into the medium.
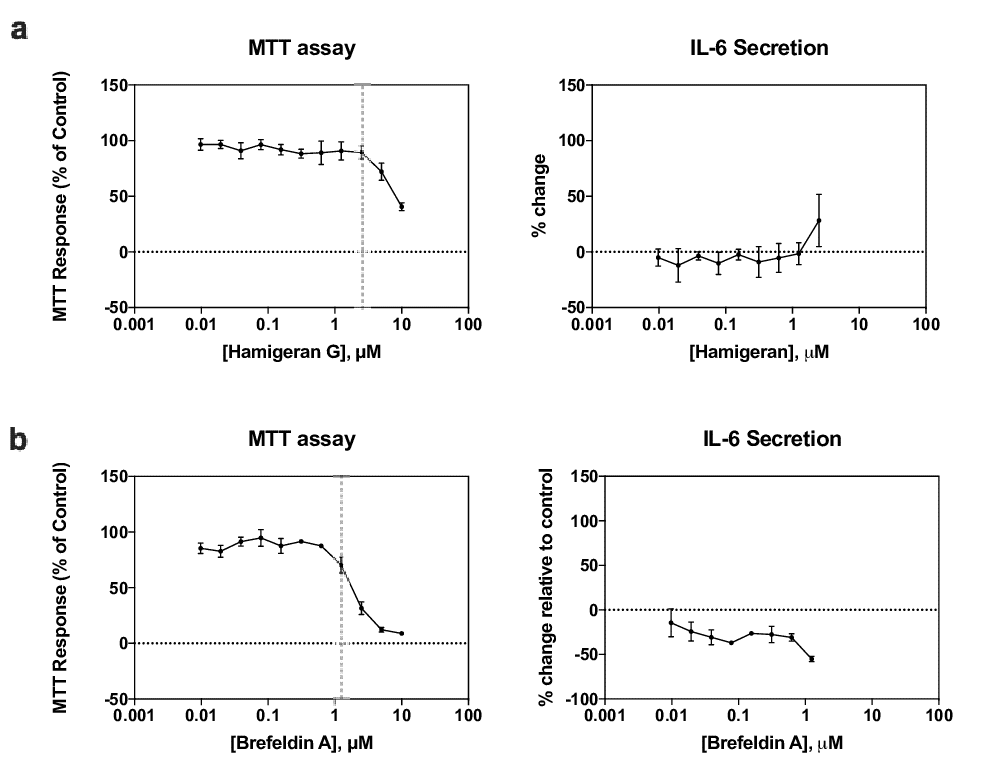
Figure 5: MTT assay and IL6 secretion of RAW264.7 cells treated with: a. hamigeran G or b. brefeldin A for 24 h. Cells were primed for secretion by the addition of IFNγ, then treated with hamigeran G or brefeldin A. Brefeldin A treatment (positive control) resulted in statistically significant decrease in IL6 secretion (P<0.05 vs control), while hamigeran G had no significant effect. Vertical lines indicate the concentrations at which the cells stopped proliferating. Data-points represent mean µ SD, n=3 independent experiments
RAW264.7 cells were primed for secretion by the addition of IFNγ. IFNγ is a cytokine that activates macrophages and signals the cells to secrete [15]. To ensure any decrease in secretion, if any, was due to inhibition by hamigeran G and not a result of cell death, only the concentrations that did not kill the cells, as determined by the MTT assay, were analyzed.
RAW264.7 cells were treated with different concentrations of hamigeran G for 24 h. The concentration-response curves are shown in Figure 5a. Using the MTT assay, it was determined that the cells started dying at concentrations above 2.5 µM. Therefore, considering only the concentrations below 2.5 µM, there was no significant difference in IL-6 secretion compared to the control. As a positive control, cells were treated with brefeldin A (Figure 5b), a protein secretion inhibitor. As expected, brefeldin A resulted in a significant decrease in IL-6 secretion compared to the control, consistent with previous studies [16]. These results indicated that hamigeran G was not targeting protein secretion, at least at concentrations below 2.5 µM.
Conclusion
Despite the evidence obtained from the chemical genomic screen in S. cerevisiae [5], it was concluded that the primary target of hamigeran G was not the Golgi apparatus and its primary functions since, even at cytotoxic concentrations, hamigeran G did not cause any significant effects on Golgi morphology, endocytosis, or protein secretion. If the Golgi network were targeted by hamigeran G, some effect would have been observed on these pathways. It is not clear why the chemical genetic screen in yeast yielded 13 hits on genes involved in Golgi and vesicular function; however, these effects may be well downstream of the actual hamigeran G target protein or they may reflect a general delayed response to cell death. Further work is needed to identify the primary target(s) and mechanism of action of hamigeran G. A possible next step into determining the target(s) of hamigeran G could be a direct biochemical technique such as pull-down of the target by affinity chromatography as described by Mabuchi et al. in which an immobilized hamigeran G could bind its target protein/s from a cell lysate and the bound protein(s) released by cleavage from the immobilized matrix [17].
Acknowledgement
The work was supported by the Wellington Medical Research Foundation, the Cancer Society of New Zealand, and Victoria University of Wellington.
Conflict of interest and Ethical Approval
The authors declare that they have no conflicts of interest, and that no experiments on humans or animals were included in the study.
Supplementary material caption
Online resource 1 List of the Golgi-related gene hits identified in the chemical genomic screen in Saccharomyces cerevisiae. Each gene hit includes a gene description and the function of the corresponding protein. All the information was obtained from NCBI gene database.
Article Info
Article Type
Research ArticlePublication history
Received: Sun 14, Jul 2019Accepted: Tue 30, Jul 2019
Published: Mon 19, Aug 2019
Copyright
© 2023 John H. Miller. This is an open-access article distributed under the terms of the Creative Commons Attribution License, which permits unrestricted use, distribution, and reproduction in any medium, provided the original author and source are credited. Hosting by Science Repository.DOI: 10.31487/j.DDA.2019.01.03
Author Info
Corresponding Author
John H. MillerSchool of Biological Sciences and Centre for Biodiscovery, Victoria University of Wellington, Wellington, New Zealand
Figures & Tables
References
- Blunt JW, Carroll AR, Copp BR, Davis RA, Keyzers RA et al. (2018) Marine natural products. Nat Prod Rep 35: 8-53. [Crossref]
- Newman DJ, Cragg GM (2016) Natural products as sources of new drugs from 1981 to 2014. J Nat Prod 79: 629-661. [Crossref]
- Cambie RC, Lal AR, Kernan MR, Bergquist PR (1995) Chemistry of sponges, 17. A novel brominated benzocylooctane derivative from Hamigera taragensis. J Nat Prod 58: 940-942.
- Wellington KD, Cambie RC, Rutledge PS, Bergquist PR (2000) Chemistry of sponges. 19. Novel bioactive metabolites from Hamigera tarangaensis. J Nat Prod 63: 79-85. [Crossref]
- Singh AJ, Dattelbaum JD, Field JJ, Smart Z, Woolly EF et al. (2013) Structurally diverse hamigerans from the New Zealand marine sponge Hamigera tarangaensis: NMR-directed isolation, structure elucidation and antifungal activity. Org Biomol Chem 11: 8041-8051. [Crossref]
- Dattelbaum JD, Singh AJ, Field JJ, Miller JH, Northcote PT (2015) The nitrogenous hamigerans: Unusual amino acid-derivatized aromatic diterpenoid metabolites from the New Zealand marine sponge Hamigera tarangaensis. J Org Chem 80: 304-312. [Crossref]
- Woolly EF, Singh AJ, Russell ER, Miller JH, Northcote PT (2018) Hamigerans R and S: Nitrogenous diterpenoids from the New Zealand marine sponge Hamigera tarangaensis. J Nat Prod 81: 387-393. [Crossref]
- Smith AM, Ammar R, Nislow C, Giaever G (2010) Exploring the mode-of-action of bioactive compounds by chemical-genetic profiling in yeast. Pharmacol Ther 127: 156-164.
- Meyer KJ, Singh AJ, Cameron A, Tan AS, Leahy DC et al. (2012) Mitochondrial genome-knockout cells demonstrate a dual mechanism of action for the electron transport complex I inhibitor mycothiazole. Mar Drugs 10: 900-917. [Crossref]
- Huotari J, Helenius A (2011) Endosome maturation. EMBO J 30: 3481-3500. [Crossref]
- Ungar D, Oka T, Brittle EE, Vasile E, Lupashin VV et al. (2002) Characterization of a mammalian Golgi-localized protein complex, COG, that is required for normal Golgi morphology and function. J Cell Biol 157: 405-415. [Crossref]
- Nagahama M, Usui S, Shinohara T, Yamaguchi T, Tani K et al. (2002) Inactivation of Galpha(z) causes disassembly of the Golgi apparatus. J Cell Sci 115: 4483-4493. [Crossref]
- Fujiwara T, Oda K, Yokota S, Takatsuki A, Ikehara Y (1988) Brefeldin A causes disassembly of the Golgi complex and accumulation of secretory proteins in the endoplasmic reticulum. J Biol Chem 263: 18545-18552. [Crossref]
- Wagner M, Rajasekaran AK, Hanzel DK, Mayor S, Rodriguez-Boulan E (1994) Brefeldin A causes structural and functional alterations of the trans-Golgi network of MDCK cells. J Cell Sci 107: 933-943. [Crossref]
- Murray PJ, Wynn TA (2011) Protective and pathogenic functions of macrophage subsets. Nat Rev Immunol 11: 723-737. [Crossref]
- Zhu F-G, Gomi K, Marshall JS (1998) Short-term and long-term cytokine release by mouse bone marrow mast cells and the differentiated KU812 cell line are inhibited by brefeldin A. J Immunol 161: 2541-2551. [Crossref]
- Mabuchi M, Shimizu T, Haramura M, Tanaka A (2015) Identification and purification of target protein using affinity resin bearing a photo-labile linker. Bioorganic Med Chem Lett 25: 3373-3377. [Crossref]