Identification of the Preferred Interventional Approach to Trigeminal Ganglion Using Three-Dimensional Reconstruction Stereoscopic Model
A B S T R A C T
Trigeminal ganglion injection is a common procedure for many facial pain syndromes, including trigeminal neuralgia. The procedure is usually done under fluoroscopy guidance to target at the foramen ovale where lies the trigeminal ganglion and the mandibular branch of trigeminal nerve exits. In this project, Amira® software was used to create 3D structures that can be visualized stereoscopically and involve the structures to study the procedure pathway. The detailed anatomical structures include the skin, skull, external and internal pterygoid muscle, masseter muscle, buccinator muscle, external carotidartery and its branches, internal carotid artery and its branches, vertebral artery, trigeminal ganglion and its branches, internal jugular vein, and parotid gland were created. The structures’ relationships and potential complications are described. The 3D model is used to guide and educate students about safe procedure pathways and may potentially be used to evaluate and modify procedures scientifically.
Keywords
3D stereoscopic models, computed tomography (CT), trigeminal ganglion block, foramen ovale, clinical anatomy, anatomy teaching
Introduction
Refractory facial pain syndromes are debilitating and usually require interventional procedures or surgery to treat if medication treatments failed [1]. Blockade of trigeminal ganglion is a valuable treatment for many facial pain syndromes such as trigeminal neuralgia, persistent idiopathic facial pain, herpes-zoster, or cancer-related pain [2]. The trigeminal ganglion is an intracranial structure that sits at the Meckel cavity in the middle fossa. The trigeminal ganglion has three main branches, including the ophthalmic (V1), maxillary (V2) andmandibular (V3) branches. The V3 branch goes through the foramenovale, which is an essential access for the interventional procedure. The foramen ovale located in the posterior part of the greater wing of the sphenoid. It serves as a transition zone between intracranial and extracranial structures [3]. Currently, the most common practice of trigeminal ganglion block is under fluoroscopy guidance [4]. Since the fluoroscopy does not show soft tissues or blood vessels, the procedure is always challenging for inexperienced trainees, especially, those not knowing the regional anatomy well.
The teaching materials for a trigeminal ganglion block procedure are mostly two-dimensional cartoon or fluoroscopy pictures, which limitstrainee’s grasp and imagination of how different anatomical structures relate to each other or what structures the procedure instrument (needle) passes. The procedure trajectory is achieved by entering the face from an anterior-lateral view until it reaches and just passesthrough the foramen ovale. The most commonly described complications are bleeding, retrobulbar hematoma, or potentiallyfistula formation because of widespread arteries from anterior-lateral trajectory view [5]. In this article, we are creating a 3D model for the purpose of visualizing clinically correlated anatomical structures stereoscopically and measuring and identifying preferentialinterventional approaches to the trigeminal ganglion or foramen ovale.
Materials and Methods
I CT Data
The 3D models described in this article were developed from a de-identified patient without any clinical or radiological head and neck pathology (University of Mississippi Medical Center (UMMC)). The CT images of the patient were acquired by the Department of Radiology with a Siemens SOMATOM Definition CT scanner (Siemens, Erlangen, Germany) using routine high-resolution imaging techniques, resulting in voxel dimensions of 0.35 x 0.35 mm in axial dimension and 0.75 mm in cranio-caudal dimension. A total of 469 slices were obtained through the paranasal sinuses and upper cervical spine. The raw data was saved as de-identified Digital Imaging and Communications in Medicine (DICOM) format files [6].
II Creating and Rendering of the 3D Model
The 3D models were created using Amira® software, version 5.6 (FEI, Hillsboro, Oregon, USA) using a Dell Precision T7600 computer (Dell Incorporated, Round Rock, TX) with an NVIDIA Quadro K6000 video card (NVIDIA Corporation, Santa Clara, CA). DICOM data 283 axial images were uploaded into the Amira® object pool with the final model in the graphic window. DICOM data was reconstructed using a combination of surface rendering, volume rendering and semi-auto-combined rendering [6, 7]. One purpose of the study is to provide clinical trainees better visualization of the subject’s clinical anatomy in the face to study the interventional approach to the trigeminal ganglion, especially structures around the foramen ovale.
III Creating the Needle Trajectories
In order to identify the preferential interventional pathway to the foramen ovale, the Amira® 3D measurement tool was used to generate trajectory lines towards an artificially created point right above the foramen ovale intracranially. By symmetrically aligning the CT image slide with “oblique slice”, which creates the true axial view (XY plane, Figures 1A & 1B), the right foramen ovale was used for the model to anatomically localize “the point”- which indicates a potential spot where the interventional needle ends intracranially (Figure 1A, blue arrow). All the trajectory lines were generated by diverging them at 5 degrees horizontally and vertically (z plane, Figure 1C). Eventually, 361 (19x19) artificial trajectory lines were created on the reconstructed 3D model for statistical measurements and analysis (Figure 1D). The lines represent needles. The practical trajectories, which are the ones that didn’t pass through the bone, were selected for final analysis as described below.
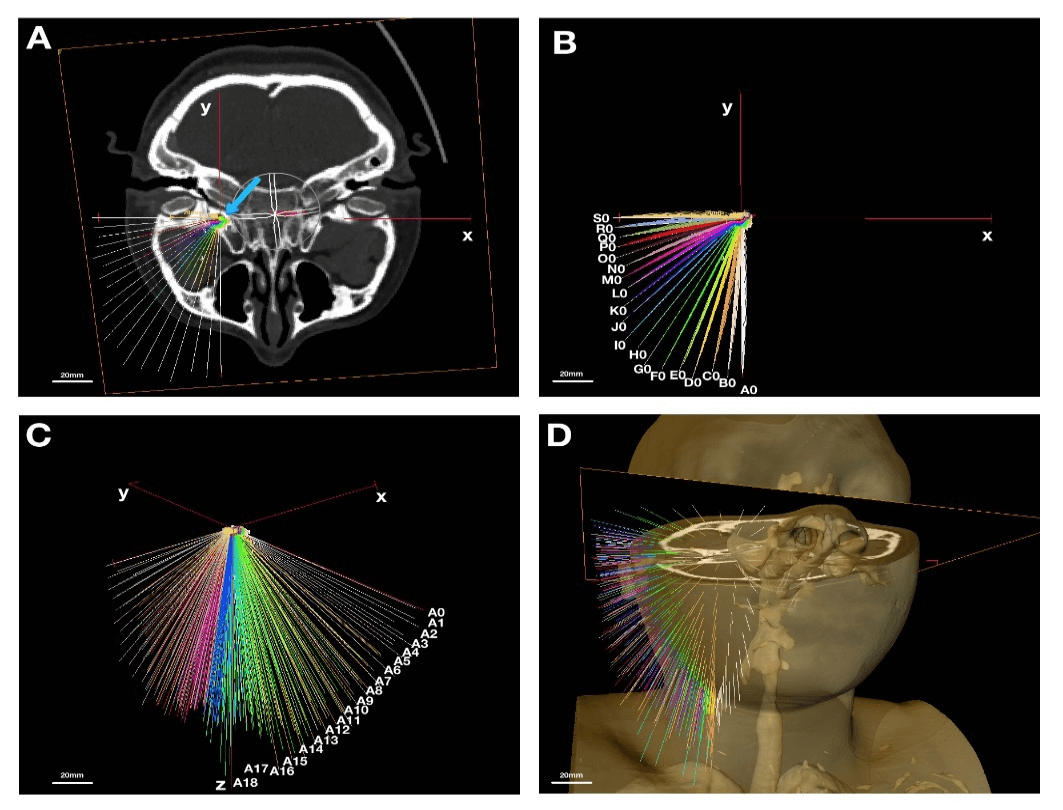
Figure 1: Creating the needle lines from CT scan; A) axial view, x-y plane, center of FO is indicated with blue arrow; B) axial view, x-y plane, needle lines horizontally are 5o apart from A0 to S0; C) y-z plane, needle lines vertically are 5o apart from A0 to A18; D) 3D view of needle lines from anterolateral view. Scale: 20mm.
IV Visualization and Presentation of 3D Stereoscopic Models
The high-resolution 3D model with the sub-millimeter resolution was then stereoscopically visualized by dual projection with a passive stereo display using dual high-definition projector system InFocus model IN3128HD, (InFocusVR Corp., Portland, OR). A linear polarized filter (polarizer film; Edmond Optics Inc., Barring, NJ) was equipped for visualization of the final model. Like other 3D visualization tools, the AmiraVR software platform (FEI, Hillsboro, OR) allows the user to generate interior views of the models. The model can be explored the way we described in the previous study [7].
V Image and Statistical Analysis
All the raw image data were analyzed by Image J (NIH, Bethesda, MD). The areas of interest were marked with the lasso tool and measured with the analysis tool (unit=mm2). All data were logged in Excel (Microsoft, Redmond, WA) and imported to SPSS (IBM, Armonk, NY) for statistical analysis. The descriptive data were in the format of mean +/- standard error. The Shapiro test was used to determine if the data were normally distributed. Either one-way ANOVA or non-parametric (Mann-Whitney) tool was used to compare and measure the significance (a=0.05). Our hypothesis is that there is no significant difference in area measurements from different needle trajectories.
Results
In this study, 3D structures of the right foramen ovale were created from CT images of a female patient. All internal structures were segmented with high-resolution detail before the surface generation. The structures labeled included skin, masseter muscle, medial pterygoid muscle, lateral pterygoid muscle, maxillary branches of the external carotid artery, foramen ovale and trigeminal ganglion, internal jugular vein, branches of the carotid artery, and parotid gland. “Needles”, which were represented by artificial trajectory lines in different colors, were drawn intracranially from the top of the inner margin of the foramen ovale (the point, Figure 1A, green dot indicated by blue arrow) towards the skin. Each needle was labeled horizontally, starting from A0 to S0 and vertically, starting from A0 to A18, as indicated in (Figures 1B & 1C).
Thus, each needle was labelled to identify the trajectory at visual analysis from A0 to S18. Needle A0 represented the first trajectory line horizontally from the tip to the coronal plane parallel to the mid-coronal plane of the face. Needle S0 represented the last trajectory horizontally from the point 90o to needle A0 (Figure 1B). The angle between each neighboring needle was 5o. Needles A0-A18 represented the needles belonging to the same coronal plane with 5o away from each other (Figure 1C). The clinical practical trajectory needles were the ones that didn’t penetrate through the bone. Of all the 316 needles, only 83 needles were counted as “practical” in this study. By their location (Figure 6A), the needles were divided into anterolateral, lateral and inferior regions (Figure 6A). The anterolateral region included from F5 to D10 (as indicated in red in Figure 6A), the lateral region included from J4 to Q6 (as indicated in green in Figure 6A), the inferior region included from A14 to J16 (as indicated in blue in Figure 6A).
With the stereoscopic view, students can visualize the important anatomical structures from all three trajectory regions. From the anterolateral region, the needle trajectory passes through the skin, potentially the buccinator muscle (transparent purple, asterisk, Figure 2A), lateral pterygoid muscle (green, Figure 2B), medial pterygoid muscle (brown, white arrowhead, Figure 2B), maxillary artery (red, black arrowhead, 2C), which occupies the foramen ovale in front of V3 (yellow, black arrow, Figure 2C), the foramen ovale (FO, black arrow, Figure 2D), and part of the transverse sinus (white arrow, Figure 2D).
From lateral region, the needle trajectory goes through skin (transparent yellow, Figure 3A), masseter muscle (red, Figure 3A), potentially parotid gland (purple, black arrowhead, Figure 3A), lateral pterygoid muscle (transparent green, black arrow, Figure 3B), maxillary artery (transparent red, black arrow, Figure 3C) which is mostly anterior medial to foramen ovale of this patient, foramen ovale (FO, black arrow, Figure 3D), and part of basilar vertebral artery (red, white arrow, Figure 3D). From the inferior view, the needle penetrates through skin, muscles and the lateral part of mandible soft tissue (green, Figure 4A), medial pterygoid muscle (brown, white arrowhead, Figure 4B), potentially lingual artery (red, black arrows, Figure 4B), V3 (yellow, black arrow, Figure 4C) and foramen ovale (FO, black arrow, Figure 4D).
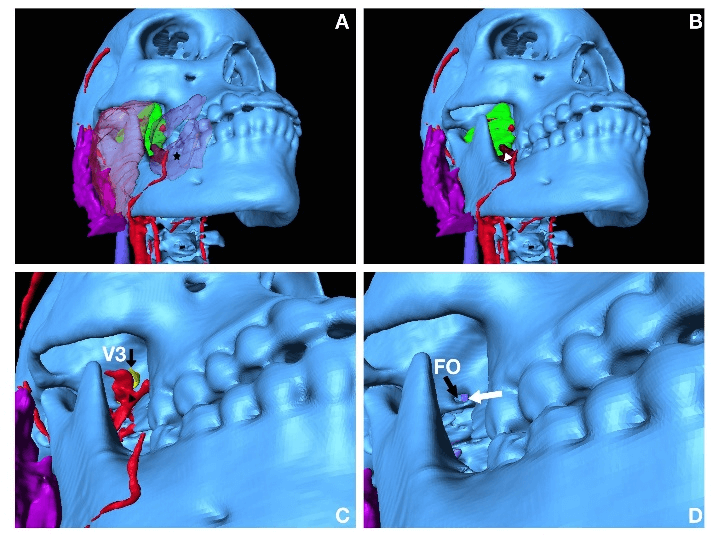
Figure 2: Approach from anterolateral region; A) surface anatomy, star indicates buccinator; B) deep structures including green lateral pterygoid and part of medial pterygoid muscle in brown indicated by white arrow head; C) deep structures including braches of maxillary artery indicated by black arrow head and V3 indicated by black arrow; D) FO indicated with black arrow, and contralateral side of partial transverse sinus indicated by white arrow.
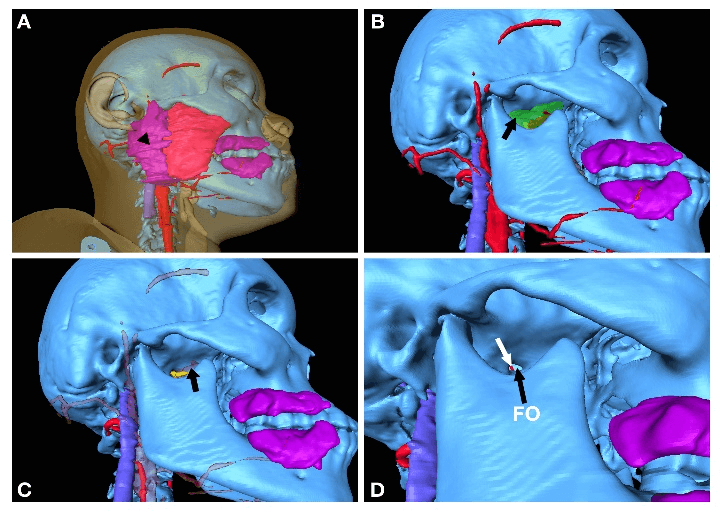
Figure 3: Approach from lateral region; A) surface anatomy, purple parotid gland indicated by black arrowhead; B) deep structures including transparent green lateral pterygoid muscle indicated by black arrow; C) deep structures including braches of transparent red maxillary artery indicated by black arrow; D) FO indicated by black arrow, and the part of basilar artery indicated by white arrow.
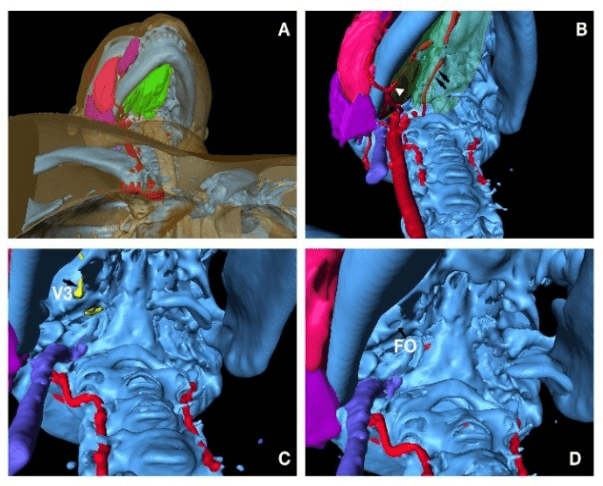
Figure 4: Approach from inferior region; A) surface anatomy, green soft tissue around mandible; B) lingual arteries indicated by black arrows, brown medial pterygoid muscle indicated by white arrowhead; C) V3 indicated by black arrow; D) FO indicated by black arrow.
Each area was measured where the practical needles went through the foramen ovale. The area of foramen in this study was equivalent to the visibility of foramen ovale under fluoroscopy. The first measurement was used the skull model only, without adding any arteries. There was a total of 22 practical anterolateral needles with a mean area of 9.503+/-1.498 mm2, 24 lateral needles with a mean area of 3.949+/-1.056 mm2, 17 inferior needles with a mean area of 9.260+/-0.762 mm2. The lateral approach had a significantly smaller visible foramen ovale compared to the anterolateral or inferior approach (p<0.05, Figure 6B). Without changing the total number of needles, the second measurement was conducted the skull model, adding the branches of the external carotid artery, especially the maxillary artery as described above. The area of interest was measured, excluding the area blocked from the arteries. The mean area of the anterolateral needles was 0.147+/-0.121mm2, of the lateral needles was 3.268+/-0.801 mm2, and of the inferior needle was 0 mm2. The lateral approach had a significantly larger visible foramen ovale without artery blockage compared to anterolateral or inferior approach (p<0.05, Figure 6C).

Figure 5: Preferential needle placement; A) lateral view of needle D9, N7, O7; B) anterolateral view of needle D9, N7, O7. Scale 20mm.
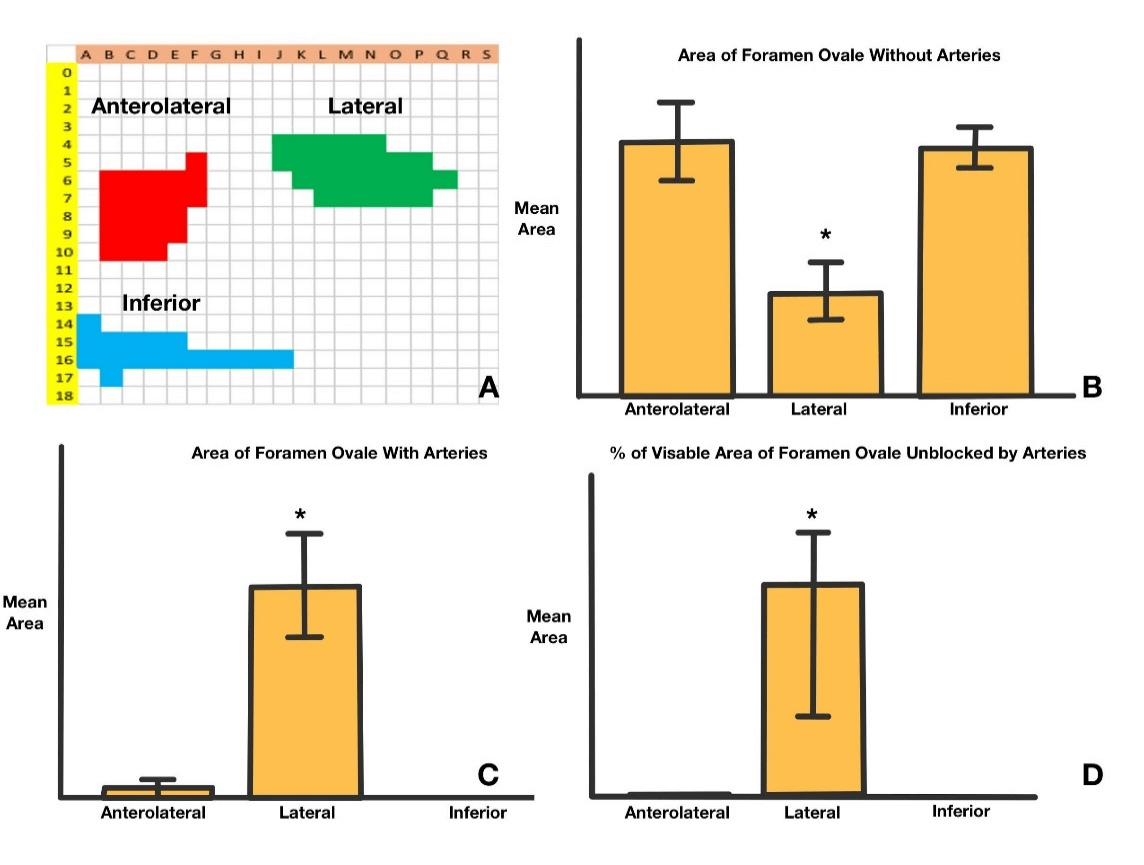
Figure 6: Statistical analysis; A) Excel chart with marked areas from A0 to S18, which includes anterolateral region marked in red, lateral region marked in green and inferior region marked in blue; B) Lateral region has significant smaller area of FO; C) Lateral region has significant larger area of visualized FO with maxillary artery blockage. D) Lateral region has significantly area not blocked by maxillary artery.
The lateral trajectory also covered more area (percentage, %) of the foramen ovale without blockage of arteries (area mean % 86.523+/-7.546, p<0.05, Figure 6D). By evaluating each needle trajectory from different locations, some anterolateral and all the lateral approaches had several needles that were both practical and non-artery-penetrating. The identified needles were B9, B10, C9, C10, D9, E8, J4, J5, K4, K5, K6, L4, L5, L6, L7, M4, M5, M6, M7, N4, N5, N6, N7, O5, O6, O7, P5, P6, P7, and Q6. With measurements of the above area of interest, the preferential trajectories with the maximum measurable area were D9 (yellow line, Figures 5A & 5B) from the anterolateral region and N7 and O7 from the lateral region (pink, brown lines, Figures 5A & 5B).
Discussion
Different virtual 3D models were previously created for the purpose of stereoscopic visualization of different surgical procedures [7]. The head and neck models based on CTA were used to help students better visualize the anatomical structures [8]. Several pieces of research described the potential benefit of 3D images by CT from a clinical perspective or CT based stereotactic surgery for trigeminal ganglion block procedures, but there are no studies on 3D stereoscopic configuration of bones and soft tissue reconstruction for trigeminal ganglion procedures and related 3D measurements [4, 9-11].
In this study, the pathway of trigeminal ganglion block trajectory was demonstrated from three different views: anterolateral, lateral, and inferior regions. The anterolateral approach is the one most commonly described in the literature [2, 10, 12, 13]. Hartel described this approach, where the needle enters at a point about 3 cm lateral to the corner of the mouth and aims towards the 90o intersection of the pupillary line with a point 3 cm in front of the tragus [13]. In this study, the approximate needles for Hartel’s description are C9 and D9, which interestingly has the maximum visible area of the foramen ovale. The larger the area, more the chance that the needle goes through the foramen under fluoroscope. However, most of the foramen ovale is covered by the maxillary artery in this study; the conclusion is patients are more likely to have complications of hematoma or arterial fistula from the anterolateral approach. Cadaver based research showed that the maxillary artery was “pierced” by the needle in 1/3 of the cases at the anterolateral pathway [12]. The 3D model confirmed the above study and also showed that in this model, about 70% of the foramen ovale is completely blocked by the maxillary artery from different angles in the anterolateral region.
There are not many studies on the lateral approach to trigeminal ganglion block procedures. Nader et al. studied the pterygopalatine fossa and the injection into the spaces close to the foramen rotundum, allowing the injection to reach all branches of the trigeminal nerve [14]. Chang et al. described course injection deep to the superior head of the lateral pterygoid muscle using a lateral approach with ultrasound [15]. du Plessis et al. used the mathematical model to study the pterygopalatine fossa for treating oral facial pain [16]. In this study, the 3D model shows that the trigeminal ganglion block procedure can be achieved through the lateral approach as well. The potential structures lateral approach encounters are parotid gland (posterolateral located), masseter muscle, and lateral pterygoid muscle. Figure 3B shows the foramen ovale located deep in the superior part of pterygoid muscle as described by Chang et al., and there were almost no obstructions from the maxillary artery [15].
The statistical data confirmed that all the practical trajectories from the lateral region have visible areas of the foramen ovale to access, especially the posterolateral area of the foramen ovale. The preferred trajectory O7 has the largest area of foramen ovale, while both O7 and N7 have the same maximum visible area of foramen ovale with maxillary artery blockage. The entry point of O7 and N7 are about 45.9mm below the zygomatic arch, the angle is about 35o horizontally and 65-70o vertically to the center of foramen ovale, which is located at the meeting point about 47.3mm lateral to the nose bridge and 24.9mm anterior to the tragus.
This study also describes a new approach for needle placement, which is through the inferior region. Without considering maxillary artery occupancy, there is no significant difference in the visible area of the foramen ovale between the inferior and the lateral approach. All the practical needles go through the medial pterygoid muscle, which indicates that the needle will not pass the oral cavity where the chance of infection increases. However, with the data in this study, the maxillary artery completely blocks the foramen ovale, which definitely increases the complication of a hematoma or fistula. Combined ultrasound and fluoroscopy may be used in the future to study this approach.
In summary, the 3D model can be used to guide and educate students about safe procedure pathways and may potentially be used to evaluate and modify procedures scientifically.
Limitation of the Study
This study is limited to only one CTA data from only one patient. The branches of the internal jugular vein are not well demonstrated because most data were taken during the arterial phase of CTA. The muscle and soft tissues of the mandible cannot be differentiated from CTA data.
Article Info
Article Type
Research ArticlePublication history
Received: Sat 11, Apr 2020Accepted: Fri 01, May 2020
Published: Thu 07, May 2020
Copyright
© 2023 Dongmei Cui. This is an open-access article distributed under the terms of the Creative Commons Attribution License, which permits unrestricted use, distribution, and reproduction in any medium, provided the original author and source are credited. Hosting by Science Repository.DOI: 10.31487/j.RDI.2020.02.01
Figures & Tables
References
- Van Buyten JP, Linderoth B (2011) Invasive neurostimulation in facial pain and headache syndromes. Eur J Pain Suppl 5: 409-421.
- Peters G, Nurmikko TJ (2002) Peripheral and gasserian ganglion-level procedures for the treatment of trigeminal neuralgia. Clin J Pain 18: 28-34. [Crossref]
- Khairnar KB, Bhusari PA (2013) An anatomical study on the foramen ovale and the foramen spinosum. J Clin Diagn Res 7: 427-429. [Crossref]
- Horiguchi J, Ishifuro M, Fukuda H, Akiyama Y, Ito K (2005) Multiplanar reformat and volume rendering of a multidetector CT scan for path planning a fluoroscopic procedure on Gasserian ganglion block-a preliminary report. Eur J Radiol 53: 189-191. [Crossref]
- Benzon HT, Raj PP (2008) Raj's practical management of pain, 4th ed. Philadelphia: Mosby-Elsevier.
- Cui D, Lynch JC, Smith AD, Wilson TD, Lehman MN (2016) Stereoscopic vascular models of the head and neck: A computed tomography angiography visualization. Anat Sci Educ 9: 179-185. [Crossref]
- Chen J, Smith AD, Khan MA, Sinning AR, Conway ML et al. (2017) Visualization of stereoscopic anatomic models of the paranasal sinuses and cervical vertebrae from the surgical and procedural perspective. Anat Sci Educ 10: 598-606. [Crossref]
- Cui D, Wilson TD, Rockhold RW, Lehman MN, Lynch JC (2017) Evaluation of the effectiveness of 3D vascular stereoscopic models in anatomy instruction for first year medical students. Anat Sci Educ 10: 34-45. [Crossref]
- Candido KD, Germanovich A, Ghaly RF, Gorelick GH, Knezevic NN (2011) Case report: computed tomography scan-guided Gasserian ganglion injection of dexamethasone and lidocaine for the treatment of recalcitrant pain associated with herpes simplex type 1 infection of the ophthalmic division of the trigeminal nerve. Anesth Analg 112: 224-227. [Crossref]
- Koizuka S, Saito S, Sekimoto K, Tobe M, Obata H et al. (2009) Percutaneous radio-frequency thermocoagulation of the Gasserian ganglion guided by high-speed real-time CT fluoroscopy. Neuroradiology 51: 563-566. [Crossref]
- Guo Z, Wu B, Du C, Cheng M, Tian Y (2016) Stereotactic Approach Combined with 3D CT Reconstruction for Difficult-to-Access Foramen Ovale on Radiofrequency Thermocoagulation of the Gasserian Ganglion for Trigeminal Neuralgia. Pain Med 17: 1704-1716. [Crossref]
- Alvernia JE, Sindou MP, Dang ND, Maley JH, Mertens P (2010) Percutaneous approach to the foramen ovale: an anatomical study of the extracranial trajectory with the incorrect trajectories to be avoided. Acta Neurochir (Wien) 152: 1043-1053. [Crossref]
- Hartel F (1914) Ueber die intrakranielle injektions behandlung der trigeminusneuralgie. Med Klin 10: 582-584.
- Nader A, Kendall MC, De Oliveria GS, Chen JQ, Vanderby B et al. (2013) Ultrasound-guided trigeminal nerve block via the pterygopalatine fossa: an effective treatment for trigeminal neuralgia and atypical facial pain. Pain Physician 16: E537-E545. [Crossref]
- Chang KV, Lin CS, Lin CP, Wu WT, Ozcakar L (2017) Recognition of the Lateral Pterygoid Muscle and Plate during Ultrasound-Guided Trigeminal Nerve Block. J Clin Diagn Res 11: UL01-UL02. [Crossref]
- du Plessis M, Navsa N, Bosman MC (2010) Preliminary results on a study to locate the pterygopalatine fossa using mathematical formulae. Clin Anat 23: 931-935. [Crossref]