Implementation of a Hplc Method for the Evaluation of Urinary 4-Hydroxyphenylacetic Acid in Patients with Neuroendocrine Tumors
A B S T R A C T
Neuroendocrine tumors (NETs) are a group of neoplasms that originate from neuroendocrine cells. They can occur in various anatomic locations, most commonly in gastro intestinal tract, lungs and pancreas. In NETs associated to the carcinoid syndrome, the tumor cells produce hormones, such as serotonin. 5-Hydroxyindoleacetic acid (5-HIAA), the main metabolite of serotonin, represents an useful urinary biomarker which is routinely determined to investigate and monitor patients with carcinoid syndrome by high performance liquid chromatography (HPLC). The chromatographic profile obtained by a standardized commercial HPLC method shows also the presence of 4-hydroxyphenylacetic acid (pHPAA), which is physiologically excreted in urine of healthy people. Interestingly, in some NETs profiles we observed a high pHPAA peak that was not resolved from 5-HIAA peak at higher concentrations of one or both metabolites.Therefore, we implemented and validated a HPLC method for the determination of urinary pHPAA improving the chromatographic separation between 5-HIAA and pHPAA. In addition, we determined pHPAA levels in 40 urine samples from patients with NETs that resulted significantly higher compared to healthy subjects. Our preliminary results showed that the modified HPLC method allows to quantify accurately pHPAA that could represent a useful marker, together with 5-HIAA, for the management of patients with NETs.
Keywords
Neuroendocrine tumors, carcinoid Syndrome, 4-hydroxyphenylacetic acid, HPLC
Introduction
Neuroendocrine tumors (NETs) arise from cells of the diffuse endocrine system that exhibit a large spectrum of clinical features depending to anatomical site of the origin. The prevalence of NETs has increased over the past 40 years due to improved detection models and diagnostic protocols [1]. The most common origin of NETs is lung/bronchus (30.6%), followed by small intestine (22.2%), rectum (16.2%), colon (13.4%), pancreas (10.8%), and stomach (6.8%) [2]. NETs can be clinically symptomatic or silent and their medical management is aimed to control symptoms and limit tumor growth. According to both National Comprehensive Cancer Network (NCCN) and European Neuroendocrine Tumor Society (ENETs) guidelines, the histological examination, mitotic count, level of nuclear protein Ki67, and immunohistochemical analysis are mandatory to allow a correct classification, staging and grading of the tumor. However, different hormones or metabolites can be assayed, as specific NETs biomarkers, in serum or plasma and urine to discriminate the presence of disease and the tumor aggressiveness [3]. The determination of urinary 5-hydroxyindoleacetic acid levels (5-HIAA), the main metabolite of serotonin, is routinely used as tumor secretory marker to investigate and monitor patients with carcinoid syndrome [4, 5]. The most common analytical method used for the quantification of urinary 5-HIAA is the liquid chromatography (HPLC) coupled to electrochemical detection (ECD) [6]. The accuracy of analysis should take into account the influence of pre-analytical and analytical factors such as diet and drug intake that could interfere with urinary excretion of 5-HIAA [7-10].
Today, we are able to simultaneously determine 5-HIAA, vanilmandelic acid (VMA), and homovanillic acid (HVA) by a commercial kit for HPLC. This procedure allows to detect also the presence of 4-hydroxyphenylacetic acid (pHPAA), which is a tyrosine metabolite physiologically excreted in urine of healthy people [11, 12]. Some authors have shown a relationship between tyrosine metabolite levels and tumors [13, 14]. Interestingly, in some profiles of urine samples from NETs patients, we observed high pHPAA signals by VMA/HVA/5-HIAA procedure. Unfortunately, the chromatographic peak of pHPAA was not resolved from 5-HIAA particularly at high concentrations of one or both metabolites.
Therefore, we implemented and validated a HPLC method for the determination of urinary pHPAA using a different analytical column and a different mobile phase to improve the chromatographic separation of the metabolites. We applied this method to quantify pHPAA in urine samples collected from 40 patients with NETs and 18 healthy subjects.
Table 1: HPLC parameters
|
Time (min) |
Reagent Aa (%) |
Reagent Bb (%) |
Flow (mL/min) |
|
0.0 |
96 |
4 |
0.6 |
|
13.0 |
93 |
7 |
0.6 |
|
14.0 |
70 |
30 |
0.6 |
|
15.0 |
70 |
30 |
0.6 |
|
15.1 |
96 |
4 |
0.6 |
|
16.0 |
96 |
4 |
0.7 |
a citrate buffer pH 4.5; b acetonitrile
Materials and Methods
I Reagents and standard solutions
The analytical solvents of HPLC grade, acetonitrile, citric acid and sodium citrate tribasic dehydrate were purchased from Carlo Erba reagent (Milan, Italy). Deionized water was generated by the deionizer ElixR Essential (Merk Millipore, Germany). The VMA/HVA/5-HIAA by HPLC Reagent Kit #195-4129 was supplied by Bio-Rad (Munchen, Germany) and contained all reagents necessary for the extraction. 5-Hydroxy-iso-vanillic acid (internal standard, IS) was dissolved in 5 mL of reagent 1. The working solution of IS was prepared by dilution (1:8) of the stock solution with reagent 1. This solution was prepared freshly for each analytical batch. An aqueous stock solution of pHPAA (Santa Cruz Biotechnology, Santa Cruz, California) was prepared at a concentration of 1200 mg/L.
II Patients and samples
24-hour urine samples were collected from 18 healthy subjects (controls) and 40 patients with NETs who were followed at the Istituto Nazionale Tumori Fondazione G. Pascale IRCCS (Naples, Italy). NETs patients and controls were asked to avoid taking any food containing serotonin and any drugs containing phenothiazine, gentisic and homogentisic acid, which could interfere with the analysis [7]. The pH of urine samples was adjusted at 3.0 by adding 30 μL of 5 N HCl solution to 7 mL of urine and the samples were stored at -80 °C until analysis. The study was undertaken in accordance with the principles of the Declaration of Helsinki and Good Clinical Practice. The approval was obtained from the Technical Scientific Committee of the “Istituto Nazionale Tumori Fondazione G. Pascale IRCCS” (Naples, Italy), deliberation number 659 of 20 August 2018 (current research projects “Original Grants”).
III Preparation of calibrators and quality controls
The calibrators were prepared by enriching a normal urine pool (used as blank) with 1200 mg/L pHPAA stock solution to obtain a spiked concentration of 100 mg/L and by serial dilutions of this enriched pool with the normal urine pool to obtain the following spiked pHPAA concentrations: 50, 25, 12.5, and 6.25 mg/L. The concentration of endogenous pHPAA in the normal urine pool was obtained calculating the average intercept of the calibration curves. The calibrators were prepared freshly for each analytical batch.
Three levels of quality controls (QCs) were prepared by enriching the normal urine pool with pHPAA stock solution to obtain spiked pHPAA concentrations of 60 mg/L (H-QC), 20 mg/L (M-QC) and 4 mg/L (L-QC). All QC samples were aliquoted and stored at -80 °C until analysis.
IV Extraction procedure
Urine samples were centrifuged at 2500 r.p.m. for 10 minutes. Samples were extracted by SPE contained in the kit. Briefly, 50 μL of calibrator/QC/sample and 50 μL of IS working solution were added to 1 mL of reagent 1 and vigorously vortexed for 10 seconds. The mixture was loaded onto a disposable column filled with an anion exchange resin, which was pre-treated with reagent 1. Thereafter neutral and basic sample components and proteins were removed by 2 mL of reagent 1. In the next step 2 ml of reagent 2 were added to the column and the eluate was recovered and transferred to HPLC vials.
V LC-ECD analysis
Ten microliters of the extract were automatically injected into the HPLC system (Agilent 1260 Infinity). The separation was performed using a reverse phase column (Agilent Poroshell 120 EC-C18 2.7 μm, 4.6 x 100 mm) maintained at room temperature without guard column. The separation has been optimized using an elution gradient of mobile phase constituted by solution A (citrate buffer pH 4.5) and solution B (acetonitrile) with flow gradient (Table 1) and column head pressure from 160 to 200 bar. The total run time was of 21 min, including column washing and equilibration (5 min). pHPAA detection was acquired by ECD model 1640 (Bio-Rad Laboratories, Segrate, Italy). The setting parameters of the ECD detector were the following: potential = 0.80 V, filter = 5 s, sensitivity = 10 nA/V, baseline = 0.15 V, offset = 0.12 V.
VI Method validation
The method was validated for selectivity, linearity, extraction efficiency, imprecision, inaccuracy, carry-over, stability, LOD and LOQ. The selectivity of the method was evaluated by comparing the chromatograms of 5 different normal urine samples without IS with the chromatogram of the normal urine pool spiked with 25 mg/L pHPAA and mixed with IS.
Calibration curves were obtained analyzing the 5 calibrators in 5 separate days. The linearity of each calibration curve was evaluated by linear regression analysis, plotting pHPAA/IS ratio (y) versus the spiked pHPAA concentration (x). LOD and LOQ were defined as the lowest concentrations that provide signal to noise (S/N) ratio higher than 3 and 10, respectively. The extraction efficiency (%) of pHPAA was evaluated on the three QCs by the following formula: (measured concentration – endogenous concentration)/spiked concentration x 100. Within-day imprecision and inaccuracy were calculated analyzing the three QC levels 5 times in the same analytical run. For evaluation of between-day imprecision and inaccuracy, each QC was analyzed once a day for 12 working days along two months.
Carry-over was evaluated performing three consecutive chromatographic runs of the highest calibrator (100 mg/L) followed by three runs of a saline solution. The carry-over percentage was calculated for pHPAA and IS as ratio between the average area of analyte obtained from the saline solution and that of calibrator. pHPAA stability was evaluated analyzing the calibrator at the spiked concentrations of 50 mg/L stored at -80 °C for 12 and 18 days.
VII Statistical Analysis
Data are reported as average and SD. The statistical significance of differences between groups was evaluated using the appropriate Student’s t-test and the significance was accepted at the level of p < 0.05. The linear regression analysis was employed for the evaluation of calibration.
Results and Discussion
I Method validation
(Figure 1A) show the chromatogram obtained by the commercial method on a urine sample containing normal levels of both 5-HIAA and pHPAA. The difference between the retention times (RT) of the two metabolites was 0.65 min. Instead, the analysis of a urine with a high pHPAA level by the commercial method did not allow to separate pHPAA from 5-HIAA (Figure 1B). The analysis of the same urine sample with high pHPAA by the modified method is shown in (Figure 1C). The RT (average ± SD, n = 20) of IS and pHPAA were 7 ± 0.5 min and 13 ± 0.5 min, respectively, and the RT difference between 5-HIAA and pHPAA increased up to 2.5 min. Calibrators with a spiked pHPAA concentrations from 6.25 mg/L to 100 mg/L were prepared based on the normal values of literature [11, 12]. The average ± SD of slope and intercept of 5 different calibration curves were 0.030 ± 0.003 and 0.268 ± 0.026, respectively. The linearity was evaluated by the correlation coefficient (r2), which resulted 0.9994 (SD = 0.001). The concentration of endogenous pHPAA in the normal urine pool (blank of calibration curves) resulted equal to 8.8 ± 0.3 mg/L. Therefore, considering both endogenous and spiked pHPAA concentrations together with the carried-out dilutions, the total pHPAA concentrations of calibrators were the following: 8.8, 15, 21.2, 33.7, 58.5, and 108.1 mg/L.
The LOD and LOQ were evaluated analyzing in triplicate two normal urine samples with pHPAA concentrations of 1.2 and 3.9 mg/L, which showed S/N ratio of 3.07 and 10.25, respectively. In addition, the imprecision, as CV%, at calibration level of 8.8 mg/L was less than 10% (n = 5). The evaluation of extraction efficiency evaluated on L-QC, M-QC and H-QC resulted equal to 89.8%, 94.6% and 92.2%, respectively. The carry-over percentage was 0.64% for pHPAA and 0.34% for IS. The analysis of the calibrator containing 58.5 mg/L pHPAA, after a storage at -80 °C for 12 and 18 days, showed a variability ranging from 95 to 104%, respectively.
(Table 2) shows the within-day imprecision (CV%) and inaccuracy (bias%) for pHPAA quantification, which were less than 4.0% and -11.4%, respectively (Table 2). The between-day imprecision and inaccuracy resulted lower than 10.6% and -6.3%, respectively (Table 2).
Table 2: Within- and between-day imprecision (CV%) and inaccuracy (Bias%) for pHPAA evaluated on the three urinary QCs
|
Analyte |
Theoretical concentration (mg/L) |
Within-day (n=5) |
Between-day (n=12) |
||||
|
Measured concentration (average ± SD) |
CV% |
Bias% |
Measured concentration (average ± SD) |
CV% |
Bias% |
||
|
pHPAA |
12.8 |
11.4 ± 0.5 |
4.0 |
-11.4 |
12.4 ± 1.3 |
10.6 |
-3.3 |
|
28.7 |
25.6 ± 0.7 |
2.7 |
-10.9 |
27.7 ± 2.3 |
8.3 |
-3.4 |
|
|
68.4 |
64.3 ± 1.5 |
2.4 |
-5.9 |
64.1 ± 4.3 |
6.7 |
-6.3 |
|
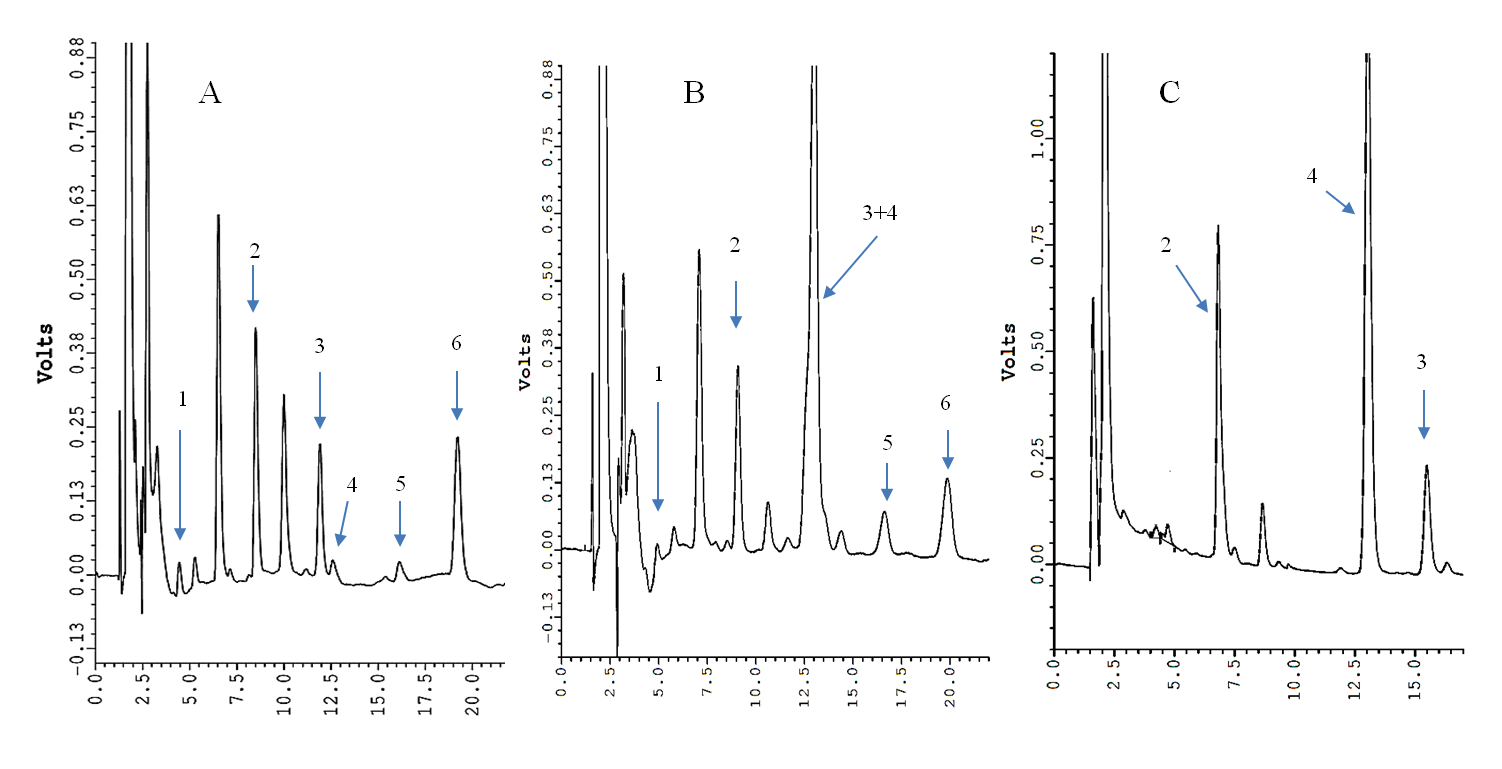
Figure 1: HPLC chromatograms of a normal urine sample by the VMA/HVA/5-HIAA kit (panel A) and a urine sample with high pHPAA level by the VMA/HVA/5-HIAA kit (panel B) and by the modified method (panel C). 1, vanilmandelic acid; 2, internal standard 1; 3, 5-HIAA; 4, pHPAA; 5, homovanillic acid; 6, internal standard 2.
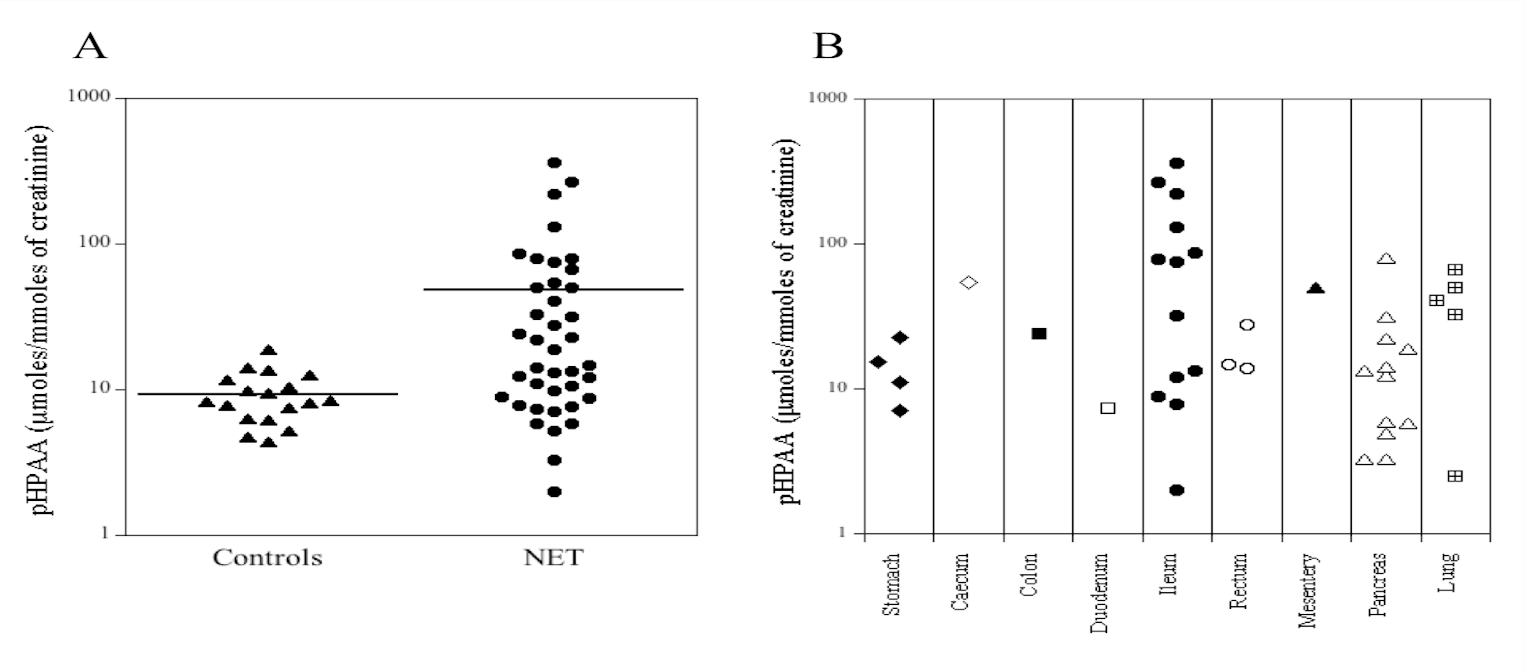
Figure 2: Dot-plot of urinary pHPAA levels (μmol/mmol creatinine) in healthy subjects (controls, n = 18) and in patients with NETs (n = 40).
II Urine pHPAA levels in healthy subjects and NETs patients
Human urines from 18 healthy subjects (controls) and 40 patients with NETs were analyzed. The pHPAA concentration (average ± SD) in the control group resulted 8.4 ± 3.0 mg/L (range: 4.0-15.3 mg/L). Instead, in NETs patients the pHPAA concentration was 44.7 ± 71.7 mg/L (range: 4.0-317.7 mg/L). The dot plots of the urinary levels of pHPAA normalized to urinary creatinine are shown in (Figure 2A). The average concentration of pHPAA in urine from controls was 9.3 μmol/mmol creatinine (range: 4.4-18.7 μmol/mmol creatinine), while in NETs patients was on average 48.1 μmol/mmol creatinine (range: 2-362.5 μmol/mmol creatinine). The values of pHPAA found in our healthy subjects were in agreement with those reported in the literature [11, 12]. Furthermore, the average of pHPAA concentrations in NETs patients was significantly higher compared to controls (p=0.003). In particular, 16/40 urine samples (40%) from patients with NETs showed significant higher levels of pHPAA, compared to the upper limit (95° percentile, 15.1 mg/L) of controls group. The (Figure 2B) shows the pHPAA urinary excretion from patients with NETs in different organs. The high levels of pHPAA found in the samples from NETs patients could be due to different clinical conditions, such as alterations and/or resections of intestinal tract as well therapeutic treatments by antibiotics or other drugs that alter the intestinal microbiota. A retrospective analysis of clinical data of patients with NETs enrolled for this study showed that 2/40 patients underwent bowel resection and the urinary pHPAA concentrations of the two patients were 49.3 and 220 mg/L.
In addition, the highest pHPAA levels observed in some patients (16/40) could be due to primary and/or secondary defects of the enzyme p-hydroxyphenylpyruvate dioxygenase in the tyrosine pathway. Moreover, the intracellular metabolism of tyrosine involves mainly two ways, the catabolic transformation into homogentisic acid or the transformation into dihydroxy-phenylalanine (L-DOPA) from which the metabolic transformation into dopamine, noradrenaline and adrenaline starts. In both metabolic pathways, vitamin C is necessary for the proper enzyme function in the different reactions downstream of the tyrosine. Vitamin C deficiency can cause a reduction, even marked, of the conversion of para-hydroxyphenylpyruvic acid into homogentisic acid with the formation of its secondary metabolite, pHPAA, which is excreted in large amount in urine. Vitamin C also takes part in the metabolic pathway that leads to catecholamine formation. In this case, a significant vitamin deficiency induces the increase in urinary HVA and VMA excretion. Therefore, even the increase of HVA and VMA production rate may perhaps lead to a high consumption of vitamin C and therefore may also cause an increase of pHPAA in urine. Indeed, the retrospective analysis of HVA and VMA levels in the 16 NETs patients with highest pHPAA showed that HVA and VMA were higher than normal values in 3/16 patients. Furthermore, the consumption of vitamin C could also be caused by the increase in the oxidative state in tumors which could lead to an indirect increase of pHPAA excretion in urines of these patients.
Conclusions
The accurate and precise determination of urinary pHPAA, implemented and validated in method, shows a good selectivity performance compared to the commercial method. The method here reported allows to separate pHPAA and 5-HIAA and it could potentially be applied for the simultaneous analysis of both compounds in urine. The excretion of pHPAA in urine samples from patients with NETs is significantly higher compared to controls. Although the relationship between tyrosine metabolites and tumors has been previously described, at present no studies reported the association between pHPAA and NETs. However, the high pHPAA levels found in NETs patients should be interpreted in the light of various clinical conditions that could cause an increase in the urinary levels of this metabolite.
Acknowledgements
The authors acknowledge the valuable technical assistance of Carmine Di Napoli (Laboratory Medicine Unit, Istituto Nazionale Tumori Fondazione G. Pascale IRCCS, Naples, Italy).
Funding
This work was supported by grants (2%) of clinical trials for the Laboratory Medicine Unit, Istituto Nazionale Tumori Fondazione G. Pascale IRCCS, Naples, Italy).
Article Info
Article Type
Research ArticlePublication history
Received: Mon 14, Oct 2019Accepted: Fri 01, Nov 2019
Published: Wed 22, Apr 2020
Copyright
© 2023 Ernesta Cavalcanti. This is an open-access article distributed under the terms of the Creative Commons Attribution License, which permits unrestricted use, distribution, and reproduction in any medium, provided the original author and source are credited. Hosting by Science Repository.DOI: 10.31487/j.COR.2019.5.16
Figures & Tables
Table 1: HPLC parameters
|
Time (min) |
Reagent Aa (%) |
Reagent Bb (%) |
Flow (mL/min) |
|
0.0 |
96 |
4 |
0.6 |
|
13.0 |
93 |
7 |
0.6 |
|
14.0 |
70 |
30 |
0.6 |
|
15.0 |
70 |
30 |
0.6 |
|
15.1 |
96 |
4 |
0.6 |
|
16.0 |
96 |
4 |
0.7 |
a citrate buffer pH 4.5; b acetonitrile
Table 2: Within- and between-day imprecision (CV%) and inaccuracy (Bias%) for pHPAA evaluated on the three urinary QCs
|
Analyte |
Theoretical concentration (mg/L) |
Within-day (n=5) |
Between-day (n=12) |
||||
|
Measured concentration (average ± SD) |
CV% |
Bias% |
Measured concentration (average ± SD) |
CV% |
Bias% |
||
|
pHPAA |
12.8 |
11.4 ± 0.5 |
4.0 |
-11.4 |
12.4 ± 1.3 |
10.6 |
-3.3 |
|
28.7 |
25.6 ± 0.7 |
2.7 |
-10.9 |
27.7 ± 2.3 |
8.3 |
-3.4 |
|
|
68.4 |
64.3 ± 1.5 |
2.4 |
-5.9 |
64.1 ± 4.3 |
6.7 |
-6.3 |
|
References
- Hallet J, Law CH, Cukier M, Saskin R, Liu N et al. (2015) Exploring the rising incidence of neuroendocrine tumors: a population-based analysis of epidemiology, metastatic presentation, and outcomes. Cancer 121: 589-597. [Crossref]
- D Man, J Wu, Z Shen, X Zhu (2018) Prognosis of patients with neuroendocrine tumor: a SEER database analysis. Cancer Manag Res 10: 5629-5638. [Crossref]
- K Oberg, IM Modlin, WD Herder, M Pavel, D Klimstra, A et al. (2015) Goldenring, Consensus on biomarkers for neuroendocrine tumour disease. Lancet Oncol 16: e435-e446. [Crossref]
- BJ Haverback, A Sjoerdsma, LL Terry (1956) Urinary excretion of the serotonin metabolite, 5-hydroxyindoleacetic acid, in various clinical conditions. N Engl J Med 255: 270-272. [Crossref]
- WT Zandee, KKamp, RC van Adrichem, RA Feelders, WW de Herder (2016) Limited value for urinary 5-HIAA excretion as prognostic marker in gastrointestinal neuroendocrine tumours. Eur J Endocrinol 175: 361-366. [Crossref]
- ZK Shihabi, J Scaro (1980) Liquid-chromatographic assay of urinary 5-hydroxy-3-indoleacetic acid, with electrochemical detection. Clin Chem 26: 907-909. [Crossref]
- IP Kema, AM Schellings, G Meiborg, CJ Hoppenbrouwers, F A Muskiet (1992) Influence of a serotonin- and dopamine-rich diet on platelet serotonin content and urinary excretion of biogenic amines and their metabolites. Clin Chem 38: 1730-1736. [Crossref]
- E Grouzmann, F Lamine, (2013) Determination of catecholamines in plasma and urine. Best Pract Res Clin Endocrinol Metab 27: 713-723. [Crossref]
- JC Honet, TV Casey, JW Jr Runyan (1959) False-positive urinary test for 5-hydroxyindoleacetic acid due to methocarbamol and mephenesin carbamate. N Engl J Med 261: 188-190. [Crossref]
- S Coward, FG Boa, RA Sherwood (1995) Sulfasalazine interference with HPLC assay of 5-hydroxyindole 3-acetic acid. Clin Chem 41: 765-766. [Crossref]
- YL Yang, F Liu, YQ Wan (2017) Simultaneous determination of 4-hydroxyphenyllactic acid, 4-hydroxyphenyl acetic acid, and 3,4-hydroxyphenyl propionicacid in human urine by ultra-high-performance liquid chromatography withfluorescence detection. J Sep Sci 40: 2117-2122. [Crossref]
- S. Bouatra, F Aziat, R Mandal, AC Guo, MR Wilson et al. (2013) The Human Urine Metabolome. PLoS One 8: e73076. [Crossref]
- L Feng, YQ He, GH Xu, H Hu, L Guo et al. (2014) Determination of Tyrosine and its metabolites in human serum with application to cancer diagnosis. Anal Lett 47: 1275-1289.
- RC Geck, AToker (2016) Nonessential amino acid metabolism in breast cancer. Adv Biol Regul 62: 11-17. [Crossref]