Implementation of Novel Mode for Evaluation of MYCN Amplification that can Predict Outcome in Patients with Neuroblastoma
A B S T R A C T
Background: Neuroblastoma tumorigenesis is a cascading process where several cytogenetic findings can be detected MYCN oncogene is a potent transcription factor that controls main cell functions. Several genetic methods can be applied in order to detect quantity of amplified MYCN oncogene. The purpose of this study is to improve the technique of determining the amplification of the MYCN oncogene in each evaluated tumor cell.
Results: Standard G banded karyotype and fluorescence in-situ hybridization (FISH) on interphase nuclei using N-MYC amplification probe was performed in five patients with different clinical presentation of neuroblastoma. Both bone marrow and tumor tissue were analysed in four and in one patient only tumor tissue. Follow up study was performed in order to obtain additional prognostic information. Additional grading system was implemented to obtain MYCN amplification status. Significant amount of amplified units was detected in two patients with adverse outcome, which was not the case in other three patients who had minor or none amplification of MYCN. Furthermore, there were no cells with significant MYCN amplification in more than 30% of the cell surface in patient three and four that represented a good prognostic factor for their survival.
Conclusion: Our study confirmed that patients with both chromosomal changes and significant MYCN amplification are characterized with aggressive clinical course. Accuracy in quantifying the amount of MYCN amplification is crucial in planning the therapeutic approach. FISH is proved to be rapid, sensitive, and reliable method for detection of MYCN oncogene amplification in routinely processed samples.
Keywords
Neuroblastoma, MYCN amplification, Cytogenetics, fluorescent in-situ hybridization
Introduction
Neuroblastoma (NB) is the most common extracranial solid tumor in children with a median incidence rate of 13.2 per million in Germany and 10.1 per million in South-Eastern Europe [1, 2]. The incidence of neuroblastoma in the Republic of North Macedonia, is two cases per year according to the Macedonian Cancer Registry [3]. Neuroblastoma is usually diagnosed within the first two years of life. There is a great heterogeneity in clinical presentation, starting from spontaneous regression in some patients to early metastatic events and death in others. Among other factors (age, site of primary tumor, histology), genetic alterations in tumor cells could point to the unfavorable outcome and aggressive behaviour of NB.
Tumorigenesis of neuroblastoma is a cascade process of multiple and complex genetic changes, including polyploidy, deletion of chromosome 1p, 11q, 17q, and most frequently detected, amplification of MYCN oncogene [4]. Predicting factors for survival include several clinical data, including patient's age, stage, and grade of tumor differentiation. Recent data determine genomic alterations within the tumor tissue as an effective prognostic marker for outcome and planning of the therapeutic strategies [5]. Depending on the presence of a specific genetic change, the prognostic risk is determined into three categories – high, medium, and low-grade malignancy [6]. If emerged in a fraction of tumor cells, some of them switch the course of the disease from favorable to aggressive [7]. MYCN amplification and structural aberrations of chromosome 11q are two genetic changes in neuroblastoma that are associated with high malignant potential. The amplification of the MYCN oncogene is considered as a biomarker with unfavorable prognostic significance, and therefore patients where MYCN amplification was found, belong to the high-risk group [6]. The purpose of this paper is to point to the significance of fluorescent in-situ hybridization (FISH) in determining the exact amplification of the MYCN oncogene.
Materials and Methods
Five patients with variable size, stage, and location of neuroblastoma were analysed (Table 1). Abdominal location of the neuroblastoma was found in 4 patients, originating from adrenal gland in three, and paraspinal nerve tissue in one patient. Neuroblastoma developed along neck ganglia in one patient. Staging was performed according the International Neuroblastoma Staging System (INSS) [8]. Bone marrow and tumor tissue specimens were analysed in 4 patients (patient 1, 2, 3 and 5), while in patient 4 only fresh tumor tissue was analysed due to the absence of bone marrow affection. Cytogenetic evaluation was made prior to therapeutic protocol, and, in addition, during the therapy in three of them. Both methods – cytogenetic evaluation and MYCN amplification were compared with the stage and the clinical outcome of the patients. Two types of cytogenetic analysis were made in all patients:
i. Conventional cytogenetic analysis both in the tumor tissue and bone marrow. At least 30 metaphases were analysed per patient.
ii. Fluorescent in-situ hybridization to determine the amplification of MYCN oncogene in the metaphases and interphase nuclei. At least a 200 interphase no overlapping nuclei in each patient were analysed.
Bone marrow and fresh tumor tissue that has been pretreated were used for cytogenetic analysis according to the standard procedure [9]. Fluorescence in-situ hybridization (FISH) was performed on metaphase spreads and interphase nuclei using standard procedure [10]. FISH analysis was performed using high-sensitive probe N-MYC- (2p24) Amplification LPS 009 (Cytocell), including both locus-specific probe (N-MYC oncogene) on chromosome 2p24 (red signal stained with TRITC, Tetramethylrhodamine isothiocyanate), and control probe – centromeric signal on chromosome 2 (CEP2-green, stained with FITC, Fluorescein isothiocyanate). Analysis was preformed both on chromosomes and interphase nuclei using fluorescent light microscope (Olympus BX51).
Amplification was evaluated as more than 4-fold increase of MYCN units in ratio to CEP2 according International consensus guidelines [11]. Determination of the level of amplification was made according the instructions stated elsewhere, verifying isolated amplified signals -double minutes (DM's) within the nucleus, or, in case of merged signals, the amount of homogeneously stained region (HSR) was assessed [10, 12]. The MYCN amplification units were quantified in every cell through manual analysis according the scale given below. For obtaining better accuracy, the evaluation was made by two independent observers. Cells without amplification were considered as follows:
A. Nuclei with 2 red MYCN and 2 green CEP2 signal - no amplification present.
B. Cells with less than 10 red signals (between 3-10 signals) - gain MYCN.
C. Cells with amplification: cells with more than 10 red signals in addition to 2 control green signals. In order to improve the estimation of the degree of the amplification, these cells were divided into two groups, a discrete and significant:
C1. Group of cells with discrete amplification consists of cells where up to 50 amplification units were detected within the nuclei.
C2. In cells with significant amplification, distinguishing between copies of DM's was difficult because of overlapping signals and the appearances of homogeneous stained regions (HSR) were detected. Additional effort for separation of these cells was made by estimating the intensity and size of fluorescence within each cell.
2a. If staining homogeneous pattern was spread up to 30% of the cell surface.
2b. If the cell covers more than 30% of its surface with HSR.
Follow up FISH studies of the bone marrow were performed in 3 patients after 6 months –two of them didn’t respond to the conventional therapy; and in the third patient who showed good response, the analysis was performed as a part of a routine check-up.
Results
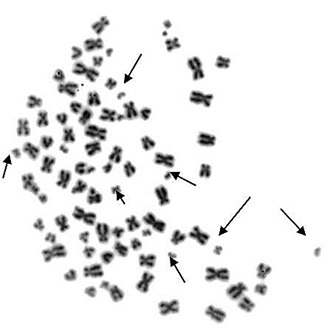
Chromosome analysis was performed in 4 patients. Significant chromosomal aberrations were found in the first two patients, including double minute chromosomes, chromosomal breaks (Figure 1) and polyploidy (mostly near-tetraploidy) (Figure 2). The chromosomal changes were present both in neuroblastoma tissue and bone marrow. After 6 months of therapy, the proportion of hyperdiploid cells in the bone marrow remained the same. In patient 3 there were only two metaphases with polyploidy in tumor tissue, but not in the bone marrow. Patient 5 didn't have chromosomal changes, while in patient 4 karyotype was not performed because a very small sample of tissue which prevented chromosome preparation. No cytogenetically visible segmental chromosomal changes such as deletion of 1p or 11q were found in analyzed patients.
Figure 1: Presence of double minutes DM's (arrows) and polyploidy in patient 1.
Figure 2: Near-tetraploidy (88,XY) in the karyotype of the second patient.
MYCN gene amplification was investigated in both bone marrow and suspended tumor tissue in four patients and only tumor cells in patient 4. Significant N-MYCN amplification was seen in the first two patients, which was concordant with the chromosomal findings. In patient 3 a small amount of MYCN amplified units was present per cell, while cells with significant amplification type C2b were not present. This patient had remission one year after therapy so far. The number of amplified cells and scoring of the amount of amplification for all patients is presented in (Table 2).
The MYCN amplification in patients 1, 3 and 5 were concordant in both tissues; in patient 2 there was discrepancy between the two tissues: amplification was more prevalent in the bone marrow than in the tumor tissue. The reason for this could be smaller amount of tumor cells into the analysed tissue.
Table 1: Characteristics of patients and analysed samples.
|
|
Patient 1 |
Patient 2 |
Patient 3 |
Patient 4 |
Patient 5 |
|
Age |
3 years |
4 years |
2 years |
9 months |
4 years |
|
Sample analysis |
Bone marrow+ tumor tissue |
Bone marrow+ tumor tissue |
Bone marrow+ tumor tissue |
Tumor tissue |
Bone marrow+ tumor tissue |
|
Stage |
4 |
4 |
4 |
1 |
2a |
|
Outcome |
metastases Deceased |
metastases Deceased |
remission (1year after) |
complete remission |
complete remission |
Table 2: Proportion of amplified cells with MYCN amplification in every patient. MYCN amplification was quantified in every cell as significant, discreet and without amplification (the percentage given without the brackets is the number of analysed cells in the bone marrow, while the number given in the brackets represents proportion of cells in the tumor tissue).
|
Presence of amplification |
|
|
Patient 1 |
Patient 2 |
Patient 3 |
Patient 4 |
Patient 5 |
|||
|
before therapy |
after 6 months |
before therapy |
after 6 months |
before therapy |
after 6 months |
|||||
|
A. No MYCN amplification |
|
|
13% (9%) |
15% |
17% (36%) |
21% |
83% (77%) |
97% |
(80%) |
100% (100%) |
|
B.MYCN gain |
|
|
/ |
|
/ (10%) |
5% |
7% (11%) |
3% |
(20% ) 3 copies (trisomy 2) |
/ |
|
C.MYCN amplification |
C1. discrete |
|
22% (28%) |
28% |
11% (28%) |
9% |
6% (7%) |
/ |
/ |
/ |
|
C2.significant |
2a |
60% (51%) |
45% |
59% (20%) |
42% |
4% (5%) |
/ |
/ |
/ |
|
|
2b |
5% (12%) |
12% |
13% (6%) |
23% |
0% (0%) |
/ |
||||
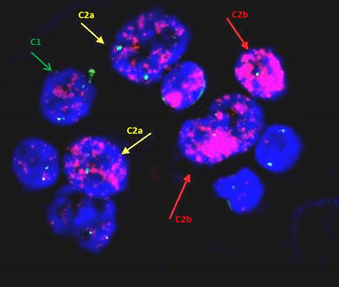
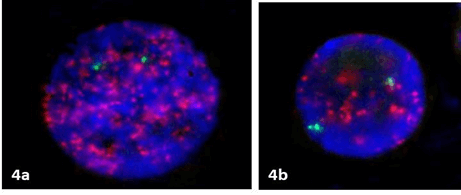
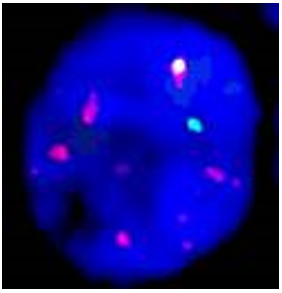
Amount of amplification in the first two patients showed heterogeneity in both tissues as shown in (Table 2) (Figures 3 & 4). In both patients MYCN amplification subsisted in the group of C2b with presence of more than 30% of HSR of their surface was present in both tissues, indicating poor prognostic outcome. The cells without amplification were present in a small percentage in the first two patients. There was less heterogeneity within cells in patient 3: MYCN gain (subgroup B) was observed in bone marrow tissue (Figure 5) and tumor tissue cells, while there were no cells that fit in the group C2b.
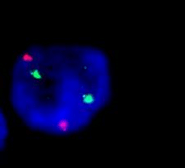
In the fourth patient where only tumor tissue was evaluated, three copies of MYCN together with three copies of control centromeric probe CEP2 were found in 20% of the cells, suggesting existence of trisomy of chromosome 2 as a clonal finding (Figure 6) [13].
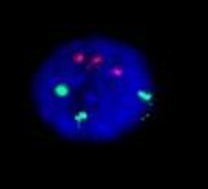
In patient 5 there were two red and two green signals in all evaluated cells, therefore no MYCN amplification was detected (Figure 7).
Figure 3: Variable amplification in the bone marrow specimen in patient 1: red arrow indicates significant amplification (C2b); yellow arrow indicates C2a amplification of less than 30% of cell surface; while green arrow points to the cell with discrete amplification (C1) with up to 50 amplicon units.
Figure 4: The presence of significant –C2a (a) and discrete –C1 (b) amplification where more than 10 copies in interphase nuclei were present in patient 2.
Figure 5: A bone marrow cell from patient 3 estimated as MYCN gain (subgroup B) with up to 10 copies of MYCN.
Figure 6: The presence of three copies of both CEP2 and MYCN amplified units in patient 4 in 20% of tumor cells.
Figure 7: A cell without amplification, in patient 5.
Discussion
Family of MYC oncogenes is a group of transcription factors that can bind along DNA and regulate a substantial proportion of the genome, being involved both in protein biosynthesis and several metabolic pathways through early action within several signal transduction pathways [14]. Members of MYC oncogene family include c-MYC, MCL and s-MYC, however only MYCN, c-MYC and MCL are involved in the tumorigenesis of specific cancers in humans [15]. MYCN oncogene is located on the short arm of chromosome 2p24. MYCN encodes a nuclear phosphoprotein of 60kDa which is capable of binding deoxyribonucleic acid in many specific ways. The protein acts as transcription factor and is involved in basic regulation of many target genes for essential cellular processes including cell proliferation, cell growth, protein synthesis, metabolism, differentiation, and apoptosis. Some studies point to a transcriptionally -independent functions of the protein including the ability of remodeling large parts of euchromatin containing active functional genes [16]. Its action is mainly through regulating the acetylation of the histones [17]. However, N-MYC is expressed during embryogenesis in many developing tissues, with a highest expression in the developing brain. After the embryonic period N-MYC is being downregulated and scarcely expressed in normal adult tissues [18]. Increased expression of N-MYC after birth leads to the development of malignancy.
Since its discovery thirty years ago, MYC is the most frequent oncogene found in many tumor tissues. Overexpression and amplification of MYCN oncogene plays a role in the pathogenesis of several types of cancer, enabling the carcinogenesis through several mechanisms: altering the metabolic programming, supporting the processes of angiogenesis and proliferation, and blocking the differentiation and apoptosis of cells [6]. MYCN overexpression was found in rhabdomyosarcomas, tongue carcinomas, neuroendocrine prostate cancer. Recent studies started to reveal the mechanism of amplification; however, the process is still not well understood. The amplification could vary in each tumor cell, between 50-400 amplified MYCN copies could be detected. This leads to abnormally increased production of a protein that stimulates tumor cells. Amplified MYCN copies could be presented in two forms – cytogenetically visible, extrachromosomal double minutes (DM's) – independently replicated, acentric, a telomeric circular chromatin structures that contain a large number of copies; or intrachromosomal homogeneously stained regions (HSR) [19, 20].
Amplification of MYCN oncogene is confirmed by many authors as marker for aggressive tumor behaviour and poor prognosis. According the International Group for determining the risk and stage of neuroblastoma, (INRGSS, International Neuroblastoma Risk Group Staging System), the presence of 10 or more copies of the MYCN oncogene within the cells represent amplification and classifies the patients in a high risk group, as is the case with two of our patients [11]. In the first two patients with significant MYCN amplification described above, follow up investigations of the MYCN amplification were made during the treatment, without improvement. They both developed metastases and died within 11/18 months despite invasive treatment. That confirmed the value of the analysis of having amplified MYCN presented as homogeneously stained region in more than 30% of cell surface as a poor prognostic sign. The first 2 patients had also numerous hyperdiploid cells, which, in combination with considerable percentage of MYCN amplification (both in number of cells and extent of amplification in each cell) are predictors for poor prognosis. In the study of Janoueix-Lerosey, where global genetic profiling was performed in a large cohort, the presence of these two markers (among others such as segmental genome changes) is present in the patients in a high risk group [21]. However, there are reports that there is no significant difference in the presence of variable MYCN amplification (DM or HSR) and survival [22].
Less than 10 MYCN copies are not sufficient to cause excessive cell proliferation, therefore is considered to be a favorable prognostic factor, although some studies confirmed that any MYCN gain is almost equally responsible for poor prognosis [13, 23, 24]. Controversies about the significance of MYCN expression in predicting the outcome still exist, since some studies confirmed that high MYCN expression is associated with favorable outcome leading to poor survival of the malignant cells [25]. Most likely more than one marker rather than solely MYCN is needed for such estimation. Evaluation of our patients supported the first hypothesis because the last three patients had favorable outcome. In addition, patient 3 didn’t have amplification of C2b group in any of the analysed cells and had advantageous outcome so far.
There are several conventional methods for detecting MYCN amplification, all with various advantages and limitations [26]. Among them, Southern blot analysis, quantitative polymerase chain reaction and interphase FISH are frequently used. The value of FISH is established by many authors, representing the attempt to analyse MYCN amplification in two ways - proportion of cells where amplification occurs, as well as determining approximate quantification of the amplification of each cell separately. The method is well established in clinical practice as fast, sensitive and technically relatively simple [9, 12]. Comparative studies between FISH and Southern blot analysis showed that FISH is more accurate method for determining the MYCN amplification when present in a small number of cells, and characterizes tumor heterogeneity more precisely [24, 27, 28]. Therefore, this is the only method that can be applied to follow-up treatment success when only a few residual cancer cells are present [9]. Recently there are attempts to implement other methods for evaluation of MYCN amplification with near identical sensitivity as FISH, such as droplet digital PCR [29].
In the era where targeted therapy based on genetic markers is available, it is mandatory to have exact measurement tool for evaluating treatment success. The possibility to inhibit MYCN amplification as a treatment strategy, assessment of the MYCN amplification (both percentage of affected cells, as well as the intensity of amplification within each cell) within the tumor tissue and distant metastases is crucial [30]. Quantification of MYCN amplification can be performed manually, as in our study; and automatically with the specially designed software for measuring the intensity of the fluorescence where problem of overlapping signals could be precluded [23].
Every center develops strategies for obtaining appropriate method to determine copy number variation. In our study, when automated quantification is not available, additional attempt was made to distinguish cells with a significant amplification by identifying the size of the fluorescence signals occupying each nucleus. Thus, the sensitivity of the FISH method was increased. However, limitation of this study of only 5 patients (low incidence rate and undersized population in our country) don’t allow a comprehensive analysis of prognostic significance of these findings, still, it represents a motivation for further research if quantification of the MYCN amplification within the cells is a valuable prognostic tool.
Conclusion
Fluorescent in-situ hybridization is a reliable and sensitive method that allows precise detection of MYCN amplification in neuroblastoma. Quantification of the amplified units within the tumor tissue and metastases facilitates the monitoring the therapeutic success.
Conflicts of Interest
None.
Article Info
Article Type
Research ArticlePublication history
Received: Mon 26, Oct 2020Accepted: Fri 06, Nov 2020
Published: Wed 18, Nov 2020
Copyright
© 2023 Sukarova-Angelovska Elena. This is an open-access article distributed under the terms of the Creative Commons Attribution License, which permits unrestricted use, distribution, and reproduction in any medium, provided the original author and source are credited. Hosting by Science Repository.DOI: 10.31487/j.COR.2020.11.04
Author Info
Gordana Ilieva Mirjana Kocova Biljana Conevska Sukarova-Angelovska Elena
Corresponding Author
Sukarova-Angelovska ElenaGenetic Laboratory, Department of Endocrinology and Genetics, University Pediatric Clinic, Skopje, North Macedonia
Figures & Tables
Table 1: Characteristics of patients and analysed samples.
|
|
Patient 1 |
Patient 2 |
Patient 3 |
Patient 4 |
Patient 5 |
|
Age |
3 years |
4 years |
2 years |
9 months |
4 years |
|
Sample analysis |
Bone marrow+ tumor tissue |
Bone marrow+ tumor tissue |
Bone marrow+ tumor tissue |
Tumor tissue |
Bone marrow+ tumor tissue |
|
Stage |
4 |
4 |
4 |
1 |
2a |
|
Outcome |
metastases Deceased |
metastases Deceased |
remission (1year after) |
complete remission |
complete remission |
Table 2: Proportion of amplified cells with MYCN amplification in every patient. MYCN amplification was quantified in every cell as significant, discreet and without amplification (the percentage given without the brackets is the number of analysed cells in the bone marrow, while the number given in the brackets represents proportion of cells in the tumor tissue).
|
Presence of amplification |
|
|
Patient 1 |
Patient 2 |
Patient 3 |
Patient 4 |
Patient 5 |
|||
|
before therapy |
after 6 months |
before therapy |
after 6 months |
before therapy |
after 6 months |
|||||
|
A. No MYCN amplification |
|
|
13% (9%) |
15% |
17% (36%) |
21% |
83% (77%) |
97% |
(80%) |
100% (100%) |
|
B.MYCN gain |
|
|
/ |
|
/ (10%) |
5% |
7% (11%) |
3% |
(20% ) 3 copies (trisomy 2) |
/ |
|
C.MYCN amplification |
C1. discrete |
|
22% (28%) |
28% |
11% (28%) |
9% |
6% (7%) |
/ |
/ |
/ |
|
C2.significant |
2a |
60% (51%) |
45% |
59% (20%) |
42% |
4% (5%) |
/ |
/ |
/ |
|
|
2b |
5% (12%) |
12% |
13% (6%) |
23% |
0% (0%) |
/ |
||||

References
- Berthold F, Spix C, Kaatsch P, Lampert F (2017) Incidence, Survival, and Treatment of Localized and Metastatic Neuroblastoma in Germany 1979-2015. Paediatr Drugs 19: 577-593. [Crossref]
- Georgakis MK, Dessypris N, Baka M, Moschovi M, Papadakis V et al. (2018) Neuroblastoma among children in Southern and Eastern European cancer registries: Variations in incidence and temporal trends compared to US. Int J Cancer 142: 1977-1985. [Crossref]
- National Institute for Health Protection. Cancer Registry of Republic of Macedonia, 2007.
- Stigliani S, Coco S, Moretti S, Oberthuer A, Fischer M et al. (2012) High genomic instability predicts survival in metastatic high-risk neuroblastoma. Neoplasia 14: 823-832. [Crossref]
- Christiansen H, Christiansen NM (2015) Progressive Neuroblastoma: Innovation and Novel Therapeutic Strategies. 20: 2.
- Brodeur GM (2003) Neuroblastoma: biological insights into a clinical enigma. Nat Rev Cancer 3: 203-216. [Crossref]
- Khan FH, Pandian V, Ramraj S, Natarajan M, Aravindan S et al. (2015) Acquired genetic alterations in tumor cells dictate the development of high-risk neuroblastoma and clinical outcomes. BMC Cancer 15: 514. [Crossref]
- PDQ Pediatric Treatment Editorial Board. Neuroblastoma Treatment (PDQ®): Health Professional Version. PDQ Cancer Information Summaries. Bethesda (MD): National Cancer Institute (US); 2002- 2019
- Shapiro DN, Valentine MB, Rowe ST, Sinclair AE, Sublett JE et al. (1993) Detection of N-myc gene amplification by fluorescence in situ hybridization. Diagnostic utility for neuroblastoma. Am J Pathol 142: 1339-1346. [Crossref]
- Mathew P, Valentine MB, Bowman LC, Rowe ST, Nash MB et al. (2001) Detection of MYCN gene amplification in neuroblastoma by fluorescence in situ hybridization: a pediatric oncology group study. Neoplasia 3: 105-109. [Crossref]
- Ambros PF, Ambros IM, Brodeur GM, Haber M, Khan J et al. (2009) International consensus for neuroblastoma molecular diagnostics: report from the International Neuroblastoma Risk Group (INRG) Biology Committee. Br J Cancer 100: 1471-1482. [Crossref]
- Wang M, Zhou C, Cai R, Li Y, Gong L (2013) Copy number gain is a recurrent genetic aberration and favorable prognostic factor in Chines pediatric neuroblastoma patient. Diagn Pathol 8: 5. [Crossref]
- Spitz R, Betts DR, Simon T, Boensch M, Oestreich J et al. (2006) Favorable outcome of triploid neuroblastomas: a contribution to the special oncogenesis of neuroblastoma. Cancer Genet Cytogenet 167: 51-56. [Crossref]
- Meyer N, Penn LZ (2008) Reflecting on 25 years with MYC. Nat Rev Cancer 8: 976-990. [Crossref]
- Adhikary S, Eilers M (2005) Transcriptional regulation and transformation by Myc proteins. Nat Rev Mol Cell Biol 6: 635-645. [Crossref]
- Cole MD, Cowling VH (2008) Transcription-independent functions of MYC: regulation of translation and DNA replication. Nat Rev Mol Cell Biol 9: 810-815. [Crossref]
- Cotterman R, Jin VX, Krig SR, Lemen JM, Wey A et al. (2008) N-Myc regulates a widespread euchromatic program in the human genome partially independent of its role as a classical transcription factor. Cancer Res 68: 6654-6662. [Crossref]
- Beltran H (2014) The N-myc Oncogene: Maximizing its Targets, Regulation, and Therapeutic Potential. Mol Cancer Res 12: 815-822. [Crossref]
- Amler LC, Schwab M (1992) Multiple amplicons of discrete sizes encompassing N-myc in -DNA. Oncogen 7: 807-809. [Crossref]
- Brodeur GM, Green AA, Hayes FA, Williams KJ, Williams D L et al. (1981) Cytogenetic features of human neuroblastomas and cell lines. Cancer Res 41: 4678-86. [Crossref]
- Lerosey IJ, Schleiermacher G, Michels E, Mosseri V, Ribeiro A et al. (2009) Overall genomic pattern is a predictor of outcome in neuroblastoma. J Clin Oncol 27: 1026-1033. [Crossref]
- Moreau LA, McGrady P, London WB, Shimada H, Cohn SL et al. (2006) Does MYCN Amplification Manifested as Homogeneously Staining Regions at Diagnosis Predict a Worse Outcome in Children with Neuroblastoma? A Children's Oncology Group Study. Clin Cancer Res 12: 5693-5697. [Crossref]
- Narath R, Lorch T, Rudas M, Ambros PF (2004) Automatoc quantification of gene amplification in clinical samples by IQ-FISH. Cytometry B Clin Cytom 57: 15-22. [Crossref]
- Jeison M, Ash S, Berko GH, Mardoukh J, Luria D et al. (2010) 2p24 Gain region harboring MYCN gene compared with MYCN amplified and nonamplified neuroblastoma: biological and clinical characteristics. Am J Pathol 176: 2616-2625. [Crossref]
- Tang XX, Zhao H, Kung B, Kim DY, Hicks SL et al. (2006) The MYCN Enigma: Significance of MYCN Expression in Neuroblastoma. Cancer Res 66: 2826-2833. [Crossref]
- Ambros IM, Benard J, Boavida M, Bown N, Caron H et al. (2003) Quality assessment of genetic markers used for therapy stratification. J Clin Oncol 21: 2077-2084. [Crossref]
- Layfield LJ, Payne CW, Shimada H, Holden JA (2005) Assessment of NMYC amplification: a comparison of FISH quantitative PCR monoplexing and traditional blotting methods used with formalin-fixed, paraffin-embedded neuroblastomas. Anal Quant Cytol Histol 27: 5-14. [Crossref]
- Qualmann SJ, Bowen J, Fitzgibbons PL, Cohn SL, Shimada H et al. (2005) Protocol for the examination of specimens from patients with neuroblastoma and related neuroblastic tumors. Arch Pathol Lab Med 129: 874-883. [Crossref]
- Somasundaram DB, Aravindan S, Yu Z, Jayaraman M, Tran NTB et al. (2019) Droplet Digital PCR as an Alternative to FISH for MYCN Amplification Detection in Human Neuroblastoma FFPE Samples. BMC Cancer 19: 106. [Crossref]
- McKeown MR, Bradner JE (2014) Therapeutic strategies to inhibit MYC. Cold Spring Harb Perspect Med 4: a014266. [Crossref]
