Long-Term Systematic Outcome Assessment of Patients Following Spine Surgery in Rwanda: The Use of Patient Reported Outcome Tools
A B S T R A C T
Background: We conducted a systematic evaluation of neurological, functional, quality of life and pain outcomes of patients who underwent spine surgery in our neurosurgery unit using patient reported outcome (PRO) assessment tools.
Methods: The study was performed by assessing outcome of all the patients who underwent spine surgery at our department in a cross-sectional fashion using a 5-year operative database. This was an all-inclusive spine outcome study with 2 main groups; a trauma group composed of spinal cord injured patients and a non-trauma group composed of patients with spinal degenerative diseases, spinal tumors, deformity, infection, and vascular malformations.
Results: Our analysis included 197 patients who met inclusion criteria for the study. The overall study population was mainly dominated by spinal cord injured patients and spinal degenerative disease patients; 34 % and 60.9 % respectively. The average age was 42 years (range: 15-78 years) with patients in the trauma group being substantially younger than the rest of the cohort. Eighty five percent of trauma patients presented with spinal cord injury causing neurological deficit, of which 58% had no preservation of motor function below the level of injury; ASIA IS A and B (35.8% and 22% respectively). Additionally, 68% of patients in the non-trauma group underwent surgery with severe disability. Overall, 60% of all trauma patients showed improvement of their neurological status as per ASIA IS. Of note, 40% of patients with preoperative ASIA IS B and 8% of patients with preoperative ASIA IS A gained full neurological recovery postoperatively (ASIA IS E). Using the Core outcome measurement Index (COMI) from patient’s perspective, 78.6% of patients reported to have no pain significant enough to make them stop their normal daily activities. Rate of overall return to work (RTW) in the non-trauma group was 77% with 52% of patients being fully functional without condition-related work interruptions.
Conclusion: Careful selection of patients for surgery is key for good outcome of patients undergoing spine surgery. In contradiction to most other patients’ groups, patients with severe disability with spinal degenerative conditions might benefit most from surgery. Postoperative outcome of spinal cord injured patients with severe neurological deficits might be better than commonly believed. Controlled prospective data is likely to draw stronger conclusions.
Keywords
Spine surgery, pain treatment, neurological recovery, spinal cord injury, patient reported outcome, ASIA IS, core outcome measurement index
Background and Study Objectives
Spine pathology represents a significant health burden worldwide [1]. Pain is a universal presenting complaint for most spine pathologies being traumatic or non-traumatic; lower back pain (LBP) is well documented as an extremely common health problem. It is the leading cause of activity limitation and work absence throughout much of the world, and it causes an enormous economic burden on individuals, families, communities, industry, and governments [1-3].
The 21st century has been particularly fruitful for spine surgery; there is little resemblance of spine surgery today compared to that practiced in the past; recent advances are especially pronounced for both open and minimally invasive spine procedures and like in many areas of medicine, progress is on an accelerated pace [4, 5]. The single most important pillar for the advanced state-of-the-art treatment of spine-related problems is the better understanding of spine biomechanics [6]. It is now standard practice that evaluation of treatment outcomes be patient centered; where outcomes of interest reflect factors important to the patient such as, adequate pain control, quality of life and functionality [7]. For spine outcome assessment, quality of life tools and patient perspective instruments are being increasingly developed and used [8].
Although spine surgery in Rwanda is in its early years, a wide range of spinal pathologies are currently being treated. The true value of our spinal interventions can be determined only by a systematic examination of patient outcomes. In the current study, we evaluated outcome of patients who underwent spine surgery for different spine pathologies, namely spinal degenerative diseases and deformity, traumatic spinal cord injury, spinal tumors and spinal vascular malformations, focusing mainly on neurological spinal cord injury recovery and ‘patient’s perspective’ outcome assessment. Our main objective was to evaluate postoperative outcome of patients following spine surgery. The following were our specific study end-points:
i. To determine postoperative Neurological and functional improvement of all traumatic spinal cord injured patients and spine degenerative disease patients, respectively.
ii. To determine postoperative status of all patients with spine-related pathologies using patient reported outcome (PRO) scales.
Patients and Methods
I Study Design
This study was a 2 phased project; the first phase was a retrospective chart review of all patients operated for spine-related pathologies by the senior author (A.E.N) over a period of 5 years; from October 2011 to December 2016. The study site was King Faisal Hospital, Kigali. At the time of the current study, this was the only tertiary referral center for spine surgery in Rwanda.
Patient’s demographics, preoperative clinical status and operative details were all recorded. The study population was made by 2 main groups; a group of patients with traumatic spinal cord injury referred to as the ‘trauma group’, and a group of patients with degenerative spine diseases, spinal tumors, and others (vascular malformations, infections and deformity) referred to as the ‘non-trauma group’. The major study groups: trauma and non-trauma have been further subdivided into cervical, thoracic, and lumbosacral subgroups in order to assess more homogenous groups of patients.
Information regarding preoperative pain status in terms of neck pain, back pain and radicular pain has been obtained for all patients (trauma and non-trauma groups) using numerical rating pain scale (see supplementary Table 1). A score of 0 is equivalent to “no pain”, Scores of 1 to 3 have been graded as “mild pain”, scores of 4 to 6 “moderate pain” and 7 to 10 as “severe pain”.
The second phase was a cross sectional outcome assessment. In order to have long-term outcome data for most patients with the shortest follow-up period being 12 months, this phase was done in December 2017 over a period of one month. Outcome assessment was done by an independent team of medical professionals who have not been involved in the management of the patients at any point.
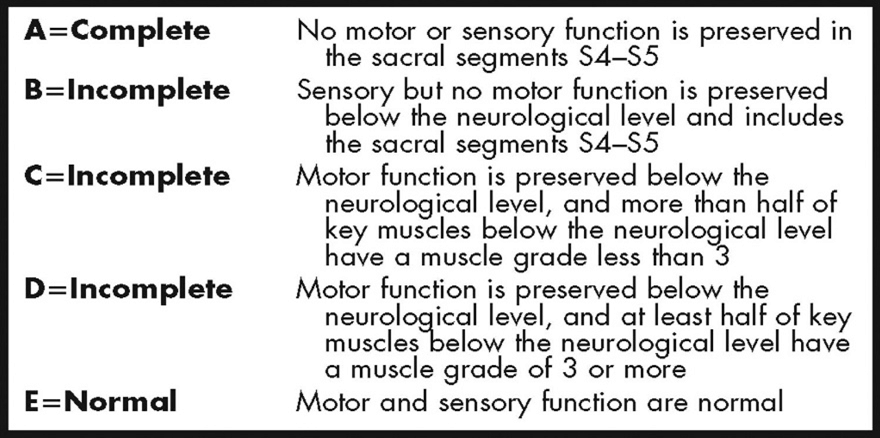
For the first primary end-point of the study, pre and postoperative neurological status were determined using the American Spinal Injury Association Impairment Scale (ASIA IS - see supplementary Table 3) and Nurick grading scale tool (see supplementary Table 2) applicable for spinal cord injured patients and spine degenerative disease patients respectively. Disability for cervical degenerative patients was categorized as follows; Nurick 0 and 1 = no disability, Nurick 2 = mild disability, Nurick 3 = moderate disability, Nurick 4 and 5 = severe disability.
For the other groups of patients (patients with lumbosacral spinal degenerative diseases, spinal deformity, infection, and tumors), severity was graded according to presence and severity of neurological status hampering employment (severe radiculopathy, neurogenic claudication, and cauda equina syndrome were graded as severely disabling symptoms).
All patients were assessed from their own perspective. Patient reported outcome measures were used to determine their pain status, functional status, and their quality of life, using the core outcome measurement index (COMI), a validated post -treatment outcome tool for spine patients from patient’s perspective (see supplementary Table 4). Of note, patients were asked to respond to the COMI questions in their utmost freedom. For pain related questions, patients were asked to report about their current pain status when off any form of analgesics (opioids and non-opioids medications).
II Selection Criteria
All the patients aged 15 years and above operated for spine related pathologies including trauma, degenerative diseases, tumors, infection, and deformities were included in the study. We excluded all the patients on whom pre and postoperative information could not be found especially due to missing contact information.
III Data Analysis Methods
The baseline preoperative data were collected using Excel then imported to STATA software 12.0. With this database, descriptive statistical analysis was performed. Using neurological, functional, and quality of life outcome tools (COMI, ASIA IS), we run comparative pre and postoperative analysis for determination of our study end points using Fisher exact test.
Results
I Study Population
Our retrospective chart review identified a total of 361 patients operated for spine-related pathologies by the senior author A.E.N. Figure 1 provides an overview of the study population. The cross-sectional outcome assessment study for primary end point determination was done on a total of 197 patients on whom complete pre and postoperative information could be obtained. Furthermore, at the time of outcome assessment, 10 patients had died for various causes. Patient reported outcome (PRO) using Core Outcome Measurement Index was hence obtained from 187 patients. Please see (Figure 2) for details of causes of death.
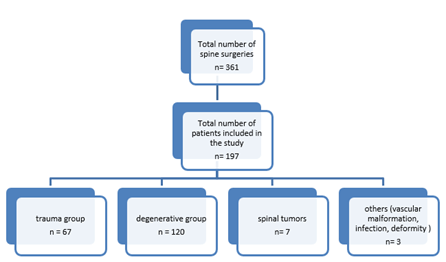
Figure 1: Flowchart of study population.
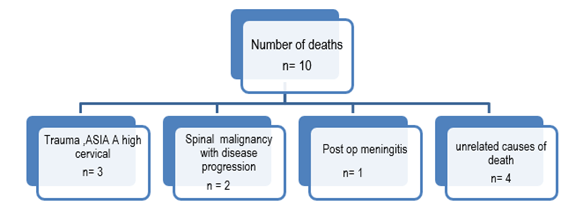
Figure 2: Mortality and causes of mortality.
II Demographics
The overall study population was mainly dominated by patients with spinal cord injuries and spinal degenerative diseases; 34 % and 60.9 % respectively. See (Table 1) for general characteristic of the study population. The overall average age was 42 years (15-78 years) with patients in the trauma group being substantially younger than the rest of the cohort. The overall male-female ratio was 1.6/1 and this difference was more pronounced for trauma patients (male-female ratio for trauma; 2.7/1). See (Table 2) summary of demographic data per spine pathology group.
Table 1: General characteristic of the study population, n=197.
|
Variable |
Freq. |
% |
|
|
Gender |
male |
123 |
62.4 |
|
female |
74 |
37.5 |
|
|
Age category |
15 – 45 |
114 |
57.8 |
|
46 - 60 |
58 |
29.4 |
|
|
61 -75 |
22 |
11.2 |
|
|
Above 75 |
3 |
1.5 |
|
|
Income level (pre -op) With correction in the national Ubudehe social economic grade |
Low income (grade 1& 2) |
86 |
43.6 |
|
Middle (grade 3) |
39 |
19.8 |
|
|
High income (Grade 4) |
25 |
12.6 |
|
|
Don’t know |
47 |
23.8 |
|
|
Spine pathology groups |
Trauma |
67 |
34 |
|
Degenerative |
120 |
60.9 |
|
|
Tumors |
7 |
3.5 |
|
|
Others;Spinal AVF, spinal Infection and deformity |
3 |
1.5 |
|
Table 2: Summary of Demographic and Baseline Characteristics n (197), according to spine pathology.
|
Variable |
Trauma Freq. (%) |
Degenerative Freq. (%) |
Tumor Freq. (%) |
Other Freq. (%) |
P values |
|
|
Gender |
Male |
49(24.8) |
69(35) |
3(1.5) |
2(1) |
|
|
Female |
18(9) |
51(25.8) |
4(2) |
1(0.5) |
|
|
|
Age |
[15-30] |
23(11.6) |
11(5.5) |
4(2) |
2(1) |
P<0.0001 |
|
[31-45] |
30(15.2) |
42(21) |
1(0.5) |
1(0.5) |
||
|
[46-60] |
13(6.5) |
44(22.3) |
1(0.5) |
0(0) |
||
|
[61-75] |
1(0.5) |
20(10) |
1(0.5) |
0(0) |
||
|
Social economic status |
High income |
8(4) |
17(8.6) |
0(0) |
0(0) |
P=0.8596 |
|
Medium income |
15(7.6) |
24(12.1) |
0(0) |
0(0) |
||
|
Low income |
19(9.6) |
37(18.7) |
1(0.5) |
0(0) |
||
|
No Job |
8(4) |
20(10) |
1(0.5) |
0(0) |
||
III Preoperative Clinical Data
Pain was a universal complaint for all the patients preoperatively. The majority of patients had symptoms associated with root involvement; severe radicular pain was present in 55% of patients preoperatively and 22% of these had features of cauda equina syndrome. Lower back pain was more prevalent than neck pain; 35.5% vs. 17.7% respectively (see Table 3).
Table 3: Preoperative symptoms and severity for all the patients, n =197.
|
Variable |
Freq. |
% |
|
|
Neck pain |
Severe |
35 |
17.7 |
|
Moderate |
14 |
7.1 |
|
|
Mild |
1 |
0. |
|
|
Back pain |
Severe |
70 |
35.5 |
|
Moderate |
22 |
11.17 |
|
|
Mild |
2 |
1 |
|
|
Radicular pain (any) |
Severe |
110 |
55.8 |
|
Moderate |
72 |
36.5 |
|
|
Mild |
10 |
5 |
|
|
Cauda Equina syndrome |
Present |
45 |
22.8 |
|
Absent |
133 |
67.5 |
|
|
no response |
19 |
9.6 |
|
Table 4: Summary of preoperative neurological status for trauma patients.
|
ASIA impairment scale (ASIA IS) |
Cervical patients Freq. (%) |
Thoracic, lumbar and thoracolumbar Patients Freq. (%) |
Total (%) |
Cum. |
|
A |
11(16.4) |
13(19.4) |
24(35.8) |
35.82 |
|
B |
12(17.9) |
3(4) |
15(22.4) |
58.21 |
|
C |
2(3) |
4(6) |
6(8.9) |
67.16 |
|
D |
5(7.4) |
5(7.4) |
10(14.9) |
82.09 |
|
E |
8(12) |
4(6) |
12(17.9) |
100 |
|
Total |
38(56) |
29(43) |
67(100) |
|
Table 5: Preoperative disability grading for the non-trauma patients (spine degenerative patients and others).
|
Disability |
Cervical subgroup Freq (%) |
Lumbosacral subgroup Freq (%) |
Overall -non trauma group Freq (%) |
|
Mild |
8 (6.1) |
16 (12.3) |
24 (18.4) |
|
Moderate |
11 (8.4) |
6 (4.6) |
17 (13) |
|
Severe |
35 (27%) |
52 (40%) |
89 (68.4) |
|
Total |
54 (41.5) |
74 (57) |
130 (100) |
i Preoperative Clinical Status – Trauma Group
The trauma group comprised 34% of our general population. All trauma patients have been preoperatively graded using ASIA IS (see Table 4). Eighty five percent of trauma patients presented with spinal cord injury causing neurological deficit, of which 58% had no preservation of motor function below the level of injury; ASIA IS A and B (35.8% and 22% respectively). The cervical trauma subgroup made up the majority of the trauma group (56%), and there was no substantial difference in neurological status at presentation in both cervical and thoracolumbar subgroups.
ii Preoperative Clinical Status – Non-Trauma Group
Overall, most (68.4%) patients in this group were operated with severe disability. Patients in the lumbosacral subgroup tended to present with more disability impairing substantially their functional status than patients in the cervical subgroup (40% vs. 27%), P < 0.001 (see Tables 3 & 5).
Table 6: Types of spine surgeries performed.
|
|
|
Freq. |
Percent |
Cum. |
|
Cervical |
ACCF |
33 |
16.8 |
16.8 |
|
ACDF |
40 |
20.3 |
37.1 |
|
|
Posterior cervical laminectomy + fusion |
14 |
7.1 |
44.2 |
|
|
Laminectomy+tumor removal |
1 |
0.5 |
44.7 |
|
|
Posterior cervical laminoplasty |
4 |
2.0 |
46.7 |
|
|
CCJ |
C1-C2fusion |
2 |
1.0 |
47.7 |
|
O-C-Fusion |
1 |
0.5 |
48.2 |
|
|
Thoracic |
Posterior decompression + T-L fusion |
15 |
7.6 |
55.8 |
|
Posterior thoracic decompression +fusion |
9 |
4.6 |
60.4 |
|
|
T spine tumor resection |
7 |
3.6 |
64.0 |
|
|
Lumbar |
Lumbar decompression only |
27 |
13.7 |
77.7 |
|
Lumbar decompression + fusion |
44 |
22.3 |
100 |
|
|
Total |
197 |
100.0 |
IV Operative Data: Types of Surgery Done
The most commonly done surgery was anterior cervical decompression and fusion (ACDF or ACCF). It comprised 37% of all the spine surgeries done during the study period. Posterior lumbar decompression surgeries were the second most commonly performed; 36%. This was done with and without additional fixation procedure in 22.3% and 13.7% of cases, respectively (see Table 6).
V Outcome Assessment Data (Postoperative Results)
The overall average time of follow up was 31 months, ranging from 10 to 72 months.
i Trauma Group
Overall, 60% of all trauma patients showed improvement of their neurological status as per ASIA IS. Of note 50% of patients with ASIA IS A showed some degree of improvement; 2 patients (8 %) to ASIA B, 3 patients (12%) to ASIA C, 5 patients (20.8% ) to ASIA D and 2 patients (8 %) to ASIA E.
All the 15 patients with preoperative ASIA IS B improved after surgery; 40% of them regained full neurological recovery (ASIA IS E). The rest improved to ASIA C and D (40% and 20% respectively); please (see Table 7) and (Figures 3A, 3B & 3C) for the details.
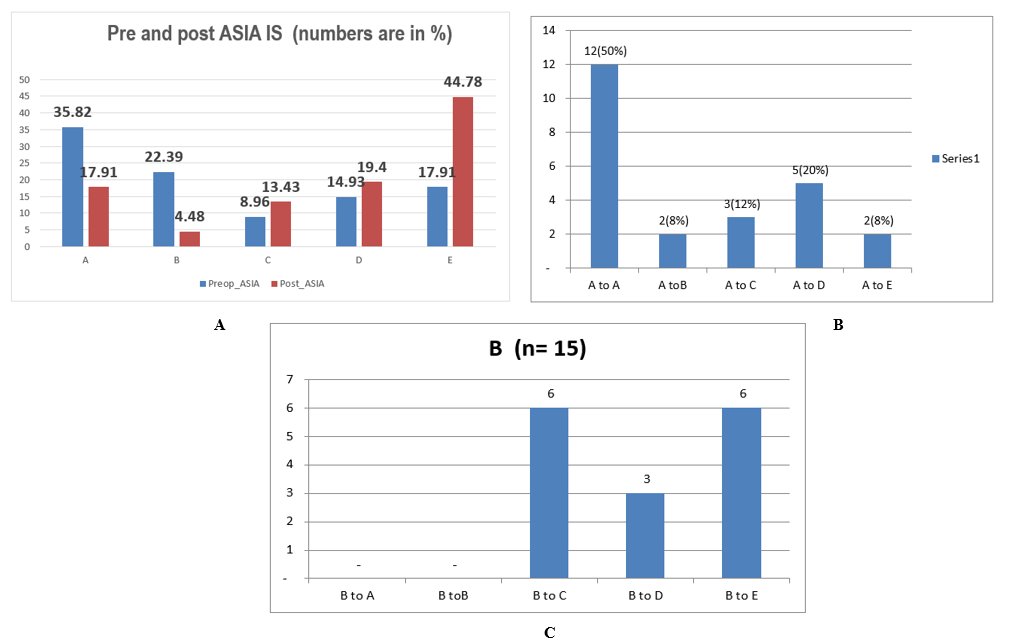
Figure 3: A) Patient’s neurological status pre and postoperatively. B) Postoperative neurological progression of ASIA A patients, n= 24. C) Postoperative neurological progression of ASIA B patients, n = 15.
Table 7: Postoperative neurological outcome for all trauma patients.
|
|
|
Postoperative ASIA IS |
||||
|
|
Grades |
A |
B |
C |
D |
E |
|
Preoperative ASIA IS; grades and corresponding number of patients |
A (n=24) |
12 |
2 |
3 |
5 |
2 |
|
B (n=15) |
- |
- |
6 |
3 |
6 |
|
|
C (n = 6) |
- |
- |
- |
- |
6 |
|
|
D (n=10) |
- |
- |
- |
3 |
7 |
|
|
E (n =12) |
- |
1 |
- |
2 |
9 |
|
Table 8: Patient’s normal activity impairment by pain.
|
Activity impairment by pain |
Freq. |
Percent |
Cum. |
|
Not at all |
108 |
57.75 |
57.75 |
|
A little |
39 |
20.86 |
78.61 |
|
Moderately |
26 |
13.9 |
92.51 |
|
Quite a bit |
14 |
7.49 |
100 |
|
Total |
187 |
100 |
ii Outcome Assessment of all the Patients using Patient Reported Outcome (PRO) Measurements
a Pain Status Assessment
We have assessed current pain status (i.e. pain at the time of outcome assessment) as per COMI (see Table supplementary); Overall, 122 (65.2%) patients reported to have no pain at the time of outcome assessment. Seven-teen percent reported mild pain, 15% reported moderate pain and 1.6% reported severe pain (see Figure 4 for details) We also assessed the degree at which patient’s normal activities are affected by pain status. The majority of patients; 78.6% reported to have no pain significant enough to make them stop their normal activity. The rest of patients reported being moderately or quite significantly disturbed by their pain during their normal activities (13.9% and 7.4% respectively), (see Table 8) for details.
b Patient Reported Quality of Life
Patients were asked to grade their own perception of overall health status. This information was obtained on 187 patients (not including the patients who had died by the time of outcome assessment). Cumulatively 65.7% of patients reported to have good and acceptable quality of life and 34.2 % reported to have a bad quality of life. The most common reasons for bad quality of life were poor urinary control, poor sexual life, neurological deficit, pain, or a combination of the above (see Table 9).
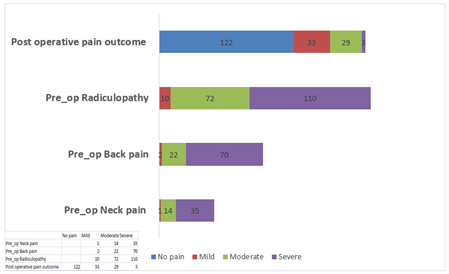
Figure 4: Postoperative pain outcome summary.
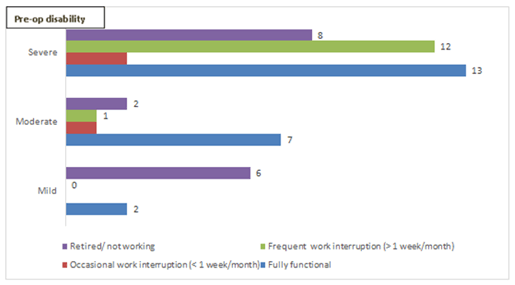
Figure 5: Postoperative functional status as per preoperative disability – cervical subgroup.
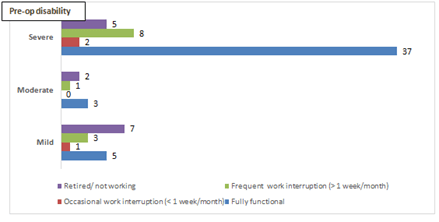
Figure 6: Postoperative functional status as per preoperative disability – lumbar subgroup.
Table 9: Postoperative patient reported overall quality of life.
|
Quality of life |
Freq |
Percent |
Cum |
|
|
Patient’s rating of overall quality of life |
Good |
70 |
37.43 |
37.43 |
|
Acceptable |
53 |
28.34 |
65.78 |
|
|
Bad |
64 |
34.22 |
100 |
|
Table 10: Postoperative Functional status of patients employed at the time of outcome assessment, all patients inclusive n=154.
|
Variables |
|
Preoperative disability |
|||
|
Overall Freq (%) |
Mild N= 65 |
Moderate N= 13 |
Severe N= 76 |
||
|
Postoperative functional status |
Fully functional |
98(63%) |
37(56%) |
10(76%) |
51(67%) |
|
Occasional interruption (< 1 week/ month) |
8(5.2%) |
3(4.6%) |
1(7.6%) |
4(5%) |
|
|
Frequent interruption (> 1week/month) |
48(31%) |
25(38.4%) |
2(15%) |
21(27%) |
|
Table 11: Overall functional outcomes of patients in the “non trauma” group.
|
Valuables |
|
Degenerative and other non-trauma subgroups |
||
|
Overall n=130 |
Cervical N= 54 |
Thoracic and lumbar N=74 |
||
|
Postoperative functional status |
Fully functional |
68 (52%) |
22(40%) |
45(72%) |
|
Occasional interruption (< 1 week/ month) |
6(4.6%) |
3(5%) |
3(4%) |
|
|
Frequent interruption (> 1 week/month) |
26(20%) |
13(24%) |
12(16.2%) |
|
|
Not working/retired |
|
30 (23%) |
16(29%) |
14(19%) |
|
Total |
|
130 (100%) |
54(100%) |
74(100%) |
Table 12: Pre and postoperative Functional status for patients with spinal non trauma cervical vs. thoracic and lumbar pathology.
|
Valuables |
Preoperative disability cervical subgroup |
Preoperative disability Thoracic and lumbar subgroup |
|||||
|
Mild (n=8) |
Moderate (n=11) |
Severe (n= 35) |
Mild (n=16) |
Moderate (n=6) |
Severe (n=52) |
||
|
Postoperative functional status |
Fully functional |
2 |
7 |
13 |
5 |
3 |
37 |
|
Occasional interruption (< 1 week/ month) |
0 |
1 |
2 |
1 |
0 |
2 |
|
|
Frequent interruption (> 1week/month) |
0 |
1 |
12 |
3 |
1 |
8 |
|
|
|
Retired/not working |
6 |
2 |
8 |
7 |
2 |
5 |
iii Overall Postoperative Functional Status
At the time of outcome assessment, 83.6% (154 out of 187) of all the patients were working and 17.6% (33 out of 187) were not (either retired or not able to work). Of the 154 patients who were working, 98 patients (63.6%) were fully working without interruption related to their condition; “fully functional”. The remaining 37% had occasional or frequent work interruptions. Of the 76 patients who were severely disabled preoperatively, 51 (67%) reported to be fully functional at the time of assessment (see Tables 10 & 11 for details).
Discussion
This study is unique in its all-inclusive nature; including all patients who had surgery for different spine pathologies
i. Demographics: The distribution of age and sex showed a substantially young population and male predominance in the trauma group; similar to what is found in other African spinal cord injury studies [9, 10].
ii. Clinical Presentation and Outcome: Pain was a universal complaint for all the patients preoperatively, and for most patients it was graded as severe. Postoperative response in pain reduction was remarkable; only 3 patients out of 187 still had severe pain at time of outcome assessment, and as many as 122 (65.2%) patients reported to have no pain. Functional disability recovery was also related to preoperative status; for patients in the non-trauma group, the ones with more severe preoperative disability were more likely to be fully functional and had less health related work interruptions than the ones with mild preoperative disability; 67% vs. 56% and 27% vs. 38.4% respectively. Upon subgroup analysis of functional disability for cervical and lumbar degenerative subgroups, patients in the latter subgroup were more likely to be fully functional (72% vs. 40%). The rate of unemployed patients was also less in the lumbar subgroup (19% vs. 29%). This might be a reflection of disabling nature of cervical myelopathy severely hampering functionality and employment. As opposed to many countries in the developed world, there is no financial compensation for failure to return to work (RTW) after spine surgery in Rwanda; thus, our findings have little if any financial bias [11].
iii. Neurological Outcomes for Trauma: Another primary end point of this study was evaluation of postoperative neurological status of patients operated for traumatic spinal cord injury.
Postoperatively, patients with intact neurological function (ASIA E) increased from 17.9% to 44%. There was a corresponding decrease, postoperatively, in the number of patients with ASIA A and B impairment scales of 38% to17.9% and 22.3% to 4.8% respectively. Fifty percent of ASIA A patients improved neurologically. The most striking improvement was noted for ASIA B patients; all of them improved to at-least one grade after surgery and 40% of them were neurologically intact (ASIA E) at time of cross-sectional outcome assessment. We found only one study with long term postoperative follow up of Traumatic spinal cord injury in the region; in that study, of the 49 patients present for follow up, 42% of patients with incomplete injury and 17% of complete injury improved [5].
There was a striking difference in neurological improvement of patients with complete injury (ASIA A) and those with complete motor with sensory preservation (ASIA B) in our study. Spinal cord injury severity is known to be a primary and robust predictor of functional recovery [12]. Sensory preservation to pin prick in at least the sacral segments predicts motor recovery [13]. Preservation of spino-thalamic tract may be a sign of reversibility of injury in the lateral corticospinal tract due to their proximity in the spinal cord [14].
Furthermore, some of these traumatic spinal cord injuries are associated with high rate of mortality when treated non-operatively [9, 10, 15].
Conclusion
Careful selection of patients for surgery is a key for good outcome of patients undergoing spine surgery. In contradiction with most other patients’ groups, patients with severe disability with spinal degenerative conditions might benefit most from surgery. Postoperative outcome of spinal cord injured patients with severe neurological deficits might be better than commonly believed. Controlled prospective data is likely to draw stronger conclusions.
Abbreviations
ACCF: Anterior Cervical Corpectomy and Fusion
ACDF: Anterior Cervical Discectomy and Fusion
ASIA IS: American Spinal Injury Association Impairment Scale
CCJ: Cranial Cervical Junction
COMI: Core Outcome Measurement Index
LPB: Lower Back Pain
O-C Fusion: Occipito-Cervical Fusion
PRO: Patient Reported Outcome
RTW: Return to Work
T-L Fusion: Thoracolumbar Fusion


Article Info
Article Type
Research ArticlePublication history
Received: Tue 13, Oct 2020Accepted: Mon 26, Oct 2020
Published: Mon 16, Nov 2020
Copyright
© 2023 Steven Nshuti. This is an open-access article distributed under the terms of the Creative Commons Attribution License, which permits unrestricted use, distribution, and reproduction in any medium, provided the original author and source are credited. Hosting by Science Repository.DOI: 10.31487/j.NNB.2020.04.02
Figures & Tables
Table 1: General characteristic of the study population, n=197.
|
Variable |
Freq. |
% |
|
|
Gender |
male |
123 |
62.4 |
|
female |
74 |
37.5 |
|
|
Age category |
15 – 45 |
114 |
57.8 |
|
46 - 60 |
58 |
29.4 |
|
|
61 -75 |
22 |
11.2 |
|
|
Above 75 |
3 |
1.5 |
|
|
Income level (pre -op) With correction in the national Ubudehe social economic grade |
Low income (grade 1& 2) |
86 |
43.6 |
|
Middle (grade 3) |
39 |
19.8 |
|
|
High income (Grade 4) |
25 |
12.6 |
|
|
Don’t know |
47 |
23.8 |
|
|
Spine pathology groups |
Trauma |
67 |
34 |
|
Degenerative |
120 |
60.9 |
|
|
Tumors |
7 |
3.5 |
|
|
Others;Spinal AVF, spinal Infection and deformity |
3 |
1.5 |
|
Table 2: Summary of Demographic and Baseline Characteristics n (197), according to spine pathology.
|
Variable |
Trauma Freq. (%) |
Degenerative Freq. (%) |
Tumor Freq. (%) |
Other Freq. (%) |
P values |
|
|
Gender |
Male |
49(24.8) |
69(35) |
3(1.5) |
2(1) |
|
|
Female |
18(9) |
51(25.8) |
4(2) |
1(0.5) |
|
|
|
Age |
[15-30] |
23(11.6) |
11(5.5) |
4(2) |
2(1) |
P<0.0001 |
|
[31-45] |
30(15.2) |
42(21) |
1(0.5) |
1(0.5) |
||
|
[46-60] |
13(6.5) |
44(22.3) |
1(0.5) |
0(0) |
||
|
[61-75] |
1(0.5) |
20(10) |
1(0.5) |
0(0) |
||
|
Social economic status |
High income |
8(4) |
17(8.6) |
0(0) |
0(0) |
P=0.8596 |
|
Medium income |
15(7.6) |
24(12.1) |
0(0) |
0(0) |
||
|
Low income |
19(9.6) |
37(18.7) |
1(0.5) |
0(0) |
||
|
No Job |
8(4) |
20(10) |
1(0.5) |
0(0) |
||
Table 3: Preoperative symptoms and severity for all the patients, n =197.
|
Variable |
Freq. |
% |
|
|
Neck pain |
Severe |
35 |
17.7 |
|
Moderate |
14 |
7.1 |
|
|
Mild |
1 |
0. |
|
|
Back pain |
Severe |
70 |
35.5 |
|
Moderate |
22 |
11.17 |
|
|
Mild |
2 |
1 |
|
|
Radicular pain (any) |
Severe |
110 |
55.8 |
|
Moderate |
72 |
36.5 |
|
|
Mild |
10 |
5 |
|
|
Cauda Equina syndrome |
Present |
45 |
22.8 |
|
Absent |
133 |
67.5 |
|
|
no response |
19 |
9.6 |
|
Table 4: Summary of preoperative neurological status for trauma patients.
|
ASIA impairment scale (ASIA IS) |
Cervical patients Freq. (%) |
Thoracic, lumbar and thoracolumbar Patients Freq. (%) |
Total (%) |
Cum. |
|
A |
11(16.4) |
13(19.4) |
24(35.8) |
35.82 |
|
B |
12(17.9) |
3(4) |
15(22.4) |
58.21 |
|
C |
2(3) |
4(6) |
6(8.9) |
67.16 |
|
D |
5(7.4) |
5(7.4) |
10(14.9) |
82.09 |
|
E |
8(12) |
4(6) |
12(17.9) |
100 |
|
Total |
38(56) |
29(43) |
67(100) |
|
Table 5: Preoperative disability grading for the non-trauma patients (spine degenerative patients and others).
|
Disability |
Cervical subgroup Freq (%) |
Lumbosacral subgroup Freq (%) |
Overall -non trauma group Freq (%) |
|
Mild |
8 (6.1) |
16 (12.3) |
24 (18.4) |
|
Moderate |
11 (8.4) |
6 (4.6) |
17 (13) |
|
Severe |
35 (27%) |
52 (40%) |
89 (68.4) |
|
Total |
54 (41.5) |
74 (57) |
130 (100) |
Table 6: Types of spine surgeries performed.
|
|
|
Freq. |
Percent |
Cum. |
|
Cervical |
ACCF |
33 |
16.8 |
16.8 |
|
ACDF |
40 |
20.3 |
37.1 |
|
|
Posterior cervical laminectomy + fusion |
14 |
7.1 |
44.2 |
|
|
Laminectomy+tumor removal |
1 |
0.5 |
44.7 |
|
|
Posterior cervical laminoplasty |
4 |
2.0 |
46.7 |
|
|
CCJ |
C1-C2fusion |
2 |
1.0 |
47.7 |
|
O-C-Fusion |
1 |
0.5 |
48.2 |
|
|
Thoracic |
Posterior decompression + T-L fusion |
15 |
7.6 |
55.8 |
|
Posterior thoracic decompression +fusion |
9 |
4.6 |
60.4 |
|
|
T spine tumor resection |
7 |
3.6 |
64.0 |
|
|
Lumbar |
Lumbar decompression only |
27 |
13.7 |
77.7 |
|
Lumbar decompression + fusion |
44 |
22.3 |
100 |
|
|
Total |
197 |
100.0 |
Table 7: Postoperative neurological outcome for all trauma patients.
|
|
|
Postoperative ASIA IS |
||||
|
|
Grades |
A |
B |
C |
D |
E |
|
Preoperative ASIA IS; grades and corresponding number of patients |
A (n=24) |
12 |
2 |
3 |
5 |
2 |
|
B (n=15) |
- |
- |
6 |
3 |
6 |
|
|
C (n = 6) |
- |
- |
- |
- |
6 |
|
|
D (n=10) |
- |
- |
- |
3 |
7 |
|
|
E (n =12) |
- |
1 |
- |
2 |
9 |
|
Table 8: Patient’s normal activity impairment by pain.
|
Activity impairment by pain |
Freq. |
Percent |
Cum. |
|
Not at all |
108 |
57.75 |
57.75 |
|
A little |
39 |
20.86 |
78.61 |
|
Moderately |
26 |
13.9 |
92.51 |
|
Quite a bit |
14 |
7.49 |
100 |
|
Total |
187 |
100 |
Table 9: Postoperative patient reported overall quality of life.
|
Quality of life |
Freq |
Percent |
Cum |
|
|
Patient’s rating of overall quality of life |
Good |
70 |
37.43 |
37.43 |
|
Acceptable |
53 |
28.34 |
65.78 |
|
|
Bad |
64 |
34.22 |
100 |
|
Table 10: Postoperative Functional status of patients employed at the time of outcome assessment, all patients inclusive n=154.
|
Variables |
|
Preoperative disability |
|||
|
Overall Freq (%) |
Mild N= 65 |
Moderate N= 13 |
Severe N= 76 |
||
|
Postoperative functional status |
Fully functional |
98(63%) |
37(56%) |
10(76%) |
51(67%) |
|
Occasional interruption (< 1 week/ month) |
8(5.2%) |
3(4.6%) |
1(7.6%) |
4(5%) |
|
|
Frequent interruption (> 1week/month) |
48(31%) |
25(38.4%) |
2(15%) |
21(27%) |
|
Table 11: Overall functional outcomes of patients in the “non trauma” group.
|
Valuables |
|
Degenerative and other non-trauma subgroups |
||
|
Overall n=130 |
Cervical N= 54 |
Thoracic and lumbar N=74 |
||
|
Postoperative functional status |
Fully functional |
68 (52%) |
22(40%) |
45(72%) |
|
Occasional interruption (< 1 week/ month) |
6(4.6%) |
3(5%) |
3(4%) |
|
|
Frequent interruption (> 1 week/month) |
26(20%) |
13(24%) |
12(16.2%) |
|
|
Not working/retired |
|
30 (23%) |
16(29%) |
14(19%) |
|
Total |
|
130 (100%) |
54(100%) |
74(100%) |
Table 12: Pre and postoperative Functional status for patients with spinal non trauma cervical vs. thoracic and lumbar pathology.
|
Valuables |
Preoperative disability cervical subgroup |
Preoperative disability Thoracic and lumbar subgroup |
|||||
|
Mild (n=8) |
Moderate (n=11) |
Severe (n= 35) |
Mild (n=16) |
Moderate (n=6) |
Severe (n=52) |
||
|
Postoperative functional status |
Fully functional |
2 |
7 |
13 |
5 |
3 |
37 |
|
Occasional interruption (< 1 week/ month) |
0 |
1 |
2 |
1 |
0 |
2 |
|
|
Frequent interruption (> 1week/month) |
0 |
1 |
12 |
3 |
1 |
8 |
|
|
|
Retired/not working |
6 |
2 |
8 |
7 |
2 |
5 |
References
- Hoy D, March L, Brooks P, Blyth F, Woolf A et al. (2014) The global burden of low back pain: estimates from the Global Burden of Disease 2010 study. Ann Rheum Dis 73: 968-974. [Crossref]
- Guo HR (2002) Working hours spent on repeated activities and prevalence of back pain. Occup Environ Med 59: 680-688. [Crossref]
- Soeker MS, Wegner L, Pretorius B (2008) I’m going back to work: back injured clients’ perceptions and experiences of their worker roles. Work 30: 161-170. [Crossref]
- Spetzger U, Schilling AV, Winkler G, Wahrburg J, König A (2013) The past, present and future of minimally invasive spine surgery: a review and speculative outlook. Minim Invasive Ther Allied Technol 22: 227-241. [Crossref]
- Thongtrangan I, Le H, Kim DH (2004) Minimally invasive spinal surgery: a historical perspective. Neurosurg Focus 16: E13. [Crossref]
- Travascio F, Eltoukhy M, Asfour S (2015) Spine Biomechanics: A Review of Current Approaches. Spine Res 1: 4.
- Mannion AF, Fekete TF, Wertli MM, Mattle M, Nauer S et al. (2015) Could Less Be More When Assessing Patient-Rated Outcome in Spinal Stenosis? Spine 40: 710-718. [Crossref]
- Terwee CB, Bot SDM, Boer MRD, Windt DAWMVD, Knol DL et al. (2007) Quality criteria were proposed for measurement properties of health status questionnaires. J Clin Epidemiol 60: 34-42. [Crossref]
- Kinyanjui JW, Mulimba JAO (2016) pattern and outcome of spinal injury at Kenyatta national hospital. EAOJ 10.
- Lehre MA, Eriksen LM, Tirsit A, Bekele S, Petros S et al. (2015) Outcome in patients undergoing surgery for spinal injury in an Ethiopian hospital. J Neurosurg Spine 23: 772-779. [Crossref]
- Vuuren BV, Zinzen E, Heerden HJV, Becker PJ, Meeusen R (2007) Work and family support systems and the prevalence of lower back problems in a South African steel industry. J Occup Rehabil 17: 409-421. [Crossref]
- Coleman WP, Geisler FH (2004) Injury severity as primary predictor of outcome in acute spinal cord injury: retrospective results from a large multicenter clinical trial. Spine 4: 373-378. [Crossref]
- Crozier KS, Graziani V, Ditunno JF, Herbison GJ (1991) Spinal cord injury: prognosis for ambulation based on sensory examination in patients who are initially motor complete. Arch Phys Med Rehabil 72: 119-121. [Crossref]
- Kirshblum SC, Connor KCO' (1998) Predicting neurologic recovery in traumatic cervical spinal cord injury. Arch Phys Med Rehabil 79: 1456-1466. [Crossref]
- Gosselin RA, Coppotelli C (2005) A follow-up study of patients with spinal cord injury in Sierra Leone. Int Orthop 29: 330-332. [Crossref]
- Staden HV, Kemp R, Beukes S (2011) Return-to-Work (RTW) of Patients after Lumbar Surgery. SAJOT 41: 70-78.