Risk Factors of Early Dental Implant Failure: A Retrospective Study
A B S T R A C T
Objective: This retrospective study aimed to assess the risk factors associated with early implant failure using a multivariate logistic regressive model and generalized evaluating equations (GEE) analysis. A total of 892 patients who received 1931 dental implants within the period from 2015 to 2018 at Odonto-Maxillo-Facial Hospital, Ho Chi Minh City, Vietnam were included in this study. Several factors as age, gender, implant placement site, implant length and diameter, sinus lifting technique, the number of implants per patient, and implant brands were recorded. GEE analysis results showed that the implant-based failure rates were 6.1% after an observation period from 3 months to 3 years. Among 118 failed implants, 108 implants were lost before or at the abutment connection stage (91.5%). Male, maxilla implant placement and implant brands were identified as the risk factors for early implant loss. Implant brands which have significantly less early failure rates are Ritter, Nobel, MIS, Osstem, Neo.
Keywords
Early dental implant failures, implant placement, multivariate analysis, risk factor, generalized evaluating equation (GEE)
Introduction
Over the past two decades, dental implants have become an integral treatment modality for partially or completely edentulous patients. In comparison with other traditional treatments such as a tooth-supported fixed partial denture or removable denture, dental implant has many prominent advantages: a high success rate (above 97% over 10 years), a decreased rate of damaging adjacent teeth, an improved maintenance of bone in edentulous site [1]. Failure of dental implant can be divided into early and late failure depending on the treatment stage, that is before abutment connection or after occlusal loading. Early failure implant treatment is the result of the inability to establish the bone-to-teeth connection and its incidence has been reported as 0.76%-7.47% [2, 3]. The factor that affects the osseointegration has been a topic of interest for researchers while reducing the risk of implant failure have become a big challenge of clinicians. Many local and systemic factors had been proved to have a correlation with early dental implant failure such as smoking habit, metabolic disorder, anatomical structure (quality and quantity of bone), surgery technique (flap or flapless, use of grafted bone, Piezosurgery or conventional drilling, insertion torque, etc), prothesis design maintainance period and others (keratinized tissue, soft tissue volume, occlusal overload, oral hygiene) [4].
In Vietnam, there have been no researches on large population sample and long term follow-up that assess factors related to early implant failure until now. Besides, the effect of commercial dental implant brand name has also still been an enigmatic element that makes clinician's confusion more confounded. Therefore, this research with title "Risk factors of early dental implant failure: a retrospective study" was conducted and aimed to assess the influence of different patient-related, surgical-related factors as well as implant brand names to the incidence of the early implant failures by using a reliable multivariable GEE logistic regression statistical method.
Materials and Methods
I Study Sample
This cross-sectional retrospective study collected information via the dental record of patients who experienced implant treatment from May, 2015 to May, 2018 at the department of dental implant- Odonto-Maxillo-Facial hospital, Ho Chi Minh City, Vietnam. The inclusion criteria was patients who had received at least 1 implant. We excluded incomplete dental records that did not contain the necessary information, including personal information (patient's name, age, gender, history and current condition of systemic diseases) and treatment protocol record. A total of 892 clinical records were included.
II Study Variables
Independent variables in this study included patient's information, surgery and implant-related factors. Patient-related data included age (≤40, 41-60 or > 60 years of age), gender (male, female), accompanying disease (yes/no). Bone augmentation, lateral sinus lift, internal sinus lift, immediate implant placement after tooth extraction are defined as surgical-related variables. Implant-related variables included implant brand name (Table 1), site of implant placement (anterior maxilla, posterior maxilla, anterior mandibular, posterior mandibular), implant diameter (narrow: <3.75mm, medium: 3.75-4.3mm, wide: >4.3mm), length (short: <10 mm, medium: 10-11.5mm, long: >11.5mm). Besides, the date of implant placement, prosthesis delivery and implant removal surgery failure were also recorded.
Table
1: Baseline information (n=892).
|
Independent variables |
Frequency (n) |
Proportion (%) |
|
Age |
Mean ± SD 48.3±14.1 |
Min-Max 18-84 |
|
≤40 years old |
289 |
32,4 |
|
41-60 years old |
427 |
47,9 |
|
>60 years old |
176 |
19,7 |
|
Gender |
|
|
|
Female |
443 |
49,7 |
|
Male |
449 |
50,3 |
|
Systemic
disease |
||
|
No |
801 |
89,8 |
|
Yes |
91 |
10.2 |
|
Implant site |
|
|
|
Anterior maxilla |
365 |
18,9 |
|
Posterior maxilla |
500 |
25,9 |
|
Anterior mandibular |
97 |
5,0 |
|
Posterior mandibular |
969 |
50,2 |
|
Implant diameter |
||
|
Narrow (<3,75 mm) |
654 |
33,9 |
|
Medium (3,75-4,3 mm) |
1095 |
56,7 |
|
Wide (>4,3 mm) |
182 |
9,4 |
|
Implant length |
|
|
|
Short (<10 mm) |
514 |
26,6 |
|
Medium (10-11,5 mm) |
1106 |
57,3 |
|
Long (>11,5 mm) |
311 |
16,1 |
|
Implant brand-name |
||
|
Nobel Conical Connection |
477 |
24,7 |
|
Nobel Active |
236 |
12,2 |
|
MIS |
401 |
20,8 |
|
Dentis |
46 |
2,4 |
|
Hitech |
51 |
2,6 |
|
Revois |
54 |
2,8 |
|
Straumann |
29 |
1,5 |
|
Straumann Active |
137 |
7,1 |
|
Osstem |
137 |
7,1 |
|
Osstem Active |
47 |
2,4 |
|
Dentium |
15 |
0,8 |
|
Ritter |
150 |
7,8 |
|
Neo |
151 |
7,8 |
III Data Analysis
Data coding was applied and recorded using Excel. Stata 13.0 software was utilized for data analysis. Frequency and proportion were utilized for quantitative variables assessment; means± standard deviation, maximum and minimum values were calculated for quantitative variables. Chi-square test or Fisher test were used to analyse the univariate relationship between treatment failure and factors: age, gender, clinical features. Logistic regression was used for multivariate analysis, elimination of confounding factors, interaction between factors related to treatment failure. GEE analysis model with binomial distribution in which a patient instead of an implant is the statistic unit. The level of statistical significance was set up at p <0.05 and 95% confidence intervals. The measurement used in this analysis is the prevalance ratio (PR).
Results
A total number of 892 dental records of patients who received 1931 dental implants were collected in this study. The frequency and relative proportion of independent variables were presented in (Table 1). Patients collected in this study have a mean age of 48.3±14.1 years, 47.9% of them are between 41 and 60 years old. The gender distribution is relatively equal, in which females accounted for 49.7%. There are 10.2% of them have systemic disorders (Table 2).
Table 2:
Accompanying systemic disorders (n=892).
|
Systemic disorders |
Frequency (n) |
Proportion (%) |
|
No |
801 |
89,8 |
|
Yes |
91 |
10.2 |
|
Name of disorder (n=91) |
|
|
|
High blood pressure |
53 |
58,2 |
|
Diabetes |
7 |
7,7 |
|
Cardiovascular disease |
8 |
8,8 |
|
High blood pressure + diabetes |
3 |
3,3 |
|
High blood pressure + cardiovascular disease |
3 |
3,3 |
|
High blood pressure + others |
3 |
3,3 |
|
High blood pressure + cardiovascular disease + diabetes |
2 |
2,2 |
|
Others |
12 |
13,2 |
Over 75% implants were placed in the posterior area, in which the number of implants in the mandibular is as twice as one in the maxillary. Around 57% medium size implants (in diameter and length) were chosen in this study. The wide and long implants were rarely indicated, which account for 9.4% and 16.1%, respectively. Nobel (including Nobel Conical Connection and Nobel Active) and MIS are the two most popular implant brands chosen in our hospital. We also had 10 other alternative brand names; the frequency of using those brands is from 0.8% (Dentium) to 7.8% (Neo and Ritter). The proportion of patients who had systemic disorders is 10.2%. 70.3% of patient has high blood pressure disorder or combination with other diseases, which make high blood pressure is the most popular disorder (Table 2).
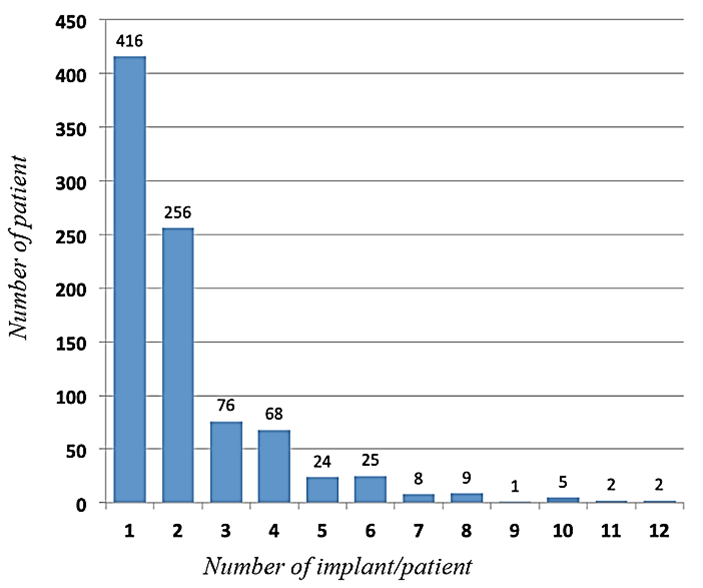
Figure 1: Number of implants per patient.
Figure 1 shows that there is 46.6% of patients had one implant placement; around 28.7% of patients have treatment with two implants. Cases of 5-12 implant restoration account for only 8.5%. Table 3 shows the number of cases that require further bone and membrane augmentation surgery. The bone graft is a relatively popular technique that accounts for 33.8% of cases; most of the cases were conducted with membrane placement. The survival rate of implant placement in this research is 93.9%. Among 118 cases of failure implant placement, the majority is an early failure, which accounts for 91.5% (Table 4). Table 5 shows that cases with Ritter implant (Ritter Dental USA, Germany) placement have the highest failure rate (16.7%), followed by Dentis (Dentis Co.LTD, USA) (13%) and Straumann Active (9.5%). Revois (Aurosan GmbH, Germany) and Dentium (Dentium, CO., LTD, Korea) implant had been placed with no failure recorded. Table 6 summarizes the GEE regression analysis method, identifying the risk factors for early implant failure: anterior maxillary implant (p=0.003), posterior maxillary implant (p=0.005), male (p=0.02). The utilize of implant Nobel (Nobel Biocare, Switzerland), MIS (MIS implant technology LTD), Ostemm (Osstem Implant Co., LTD) and Neo (Alpha-Bio Tec) resulted in a significantly lower failure rate with p<0.05.
Table 3:
Surgery-related variables (n=1931).
|
|
Frequency
(n) |
Proportion
(%) |
|
Bone augmentation |
|
|
|
No |
1278 |
66,2 |
|
Yes |
653 |
33,8 |
|
Barrier membrane |
|
|
|
No |
1394 |
72,2 |
|
Yes |
537 |
27,8 |
|
Immmediate dental implant placement |
|
|
|
No |
1719 |
89,0 |
|
Yes |
212 |
11,0 |
|
Internal sinus lift |
|
|
|
No |
1871 |
96,9 |
|
Yes |
60 |
3,1 |
|
Lateral sinus lift |
|
|
|
No |
1841 |
95,3 |
|
Yes |
90 |
4,7 |
Table 4:
Implant failure rate (n=1931).
|
|
Frequency
(n) |
Proportion
(%) |
|
Result of implant placement |
|
|
|
Failure rate |
118 |
6,1 |
|
Survival rate |
1813 |
93,9 |
|
Categories of implant failure (n=118) |
|
|
|
Early failure |
108 |
91,5 |
|
Late failure |
10 |
8,5 |
Table 5:
Distribution of implant failure by implant brand (n=1931).
|
|
Implant brand |
Frequency |
Follow-up (month) |
Total implant failure |
Early failure |
Late failure |
|
1 |
Nobel CC |
477 |
23.6±12.5 |
32 (6.7%) |
32 (6.7%) |
0 |
|
2 |
Nobel Active |
236 |
20.2±11.7 |
8 (3.4%) |
8 (3.4%) |
0 |
|
3 |
MIS |
401 |
20.9±11.0 |
19 (4,7%) |
18 (4,5%) |
1 (0,2) |
|
4 |
Dentis |
46 |
28.4±8.7 |
6 (13%) |
4 (8,7%) |
2 (4,3) |
|
5 |
Hitech |
51 |
30.6±10.0 |
1 (2,0%) |
1 (2,0%) |
0 |
|
6 |
Revois |
54 |
32.9±4.3 |
0 |
0 |
0 |
|
7 |
Straumann |
29 |
19.4±10.0 |
1 (3,4%) |
1 (3,4%) |
0 |
|
8 |
Straumann Active |
137 |
15.9±10.5 |
13 (9,5%) |
12 (8,8%) |
1 (0,7) |
|
9 |
Osstem |
137 |
17.3±5.5 |
4 (2,9%) |
4 (2,9%) |
0 |
|
10 |
Osstem Active |
47 |
15.4±5.0 |
2 (4,3%) |
2 (4,3%) |
0 |
|
11 |
Dentium |
15 |
15.6±10.4 |
0 |
0 |
0 |
|
12 |
Ritter |
150 |
14.8±6.9 |
25 (16,7%) |
22 (14,7%) |
3 (2,0) |
|
13 |
Neo |
151 |
14.2±10.5 |
7 (4,3%) |
4 (2,6%) |
3 (2,0) |
Table 6:
Multivariate risk factor analysis for early implant failure using GEE (n=1852).
|
Variables |
Result |
|
|
|
|
Failure n (%) |
Success n (%) |
p-value |
PR (CI 95%) |
|
|
Gender |
|
|
|
|
|
Female |
42(4,6) |
880 (95,4) |
|
1 |
|
Male |
66 (7,1) |
864 (92,9) |
0,02 |
1,57 (1,08-2,29) |
|
Implant site |
|
|
|
|
|
Posterior mandibular |
36 (3,88) |
893 (96,1) |
|
1 |
|
Anterior maxillary |
27 (7,7) |
336 (92,0) |
0,003 |
2,26 (1,32-3,86) |
|
Posterior maxillary |
39 (8,2) |
436 (91,8) |
0,005 |
1,89 (1,22-2,96) |
|
Anterior mandibular |
6 (6,3) |
89 (93,7) |
0,23 |
1,70 (0,72-4,06) |
|
Number of implant/patient |
|
|
|
|
|
1-2 implant |
49 (5,5) |
839 (94,5) |
|
1 |
|
3-4 implant |
27 (5,6) |
459 (94,4) |
0,88 |
0,96 (0,61-1,53) |
|
5-6 implant |
27 (10,3) |
236 (89,7) |
0,07 |
1,58 (0,98-2,57) |
|
> 6 implant |
5 (2,3) |
210 (97,7) |
0,07 |
0,43 (0,17-1,08) |
|
Implant diameter |
|
|
|
|
|
Narrow (<3,75 mm) |
32 (4,9) |
615 (95,1) |
|
1 |
|
Medium (3,75-4,3 mm) |
66 (6,4) |
964 (93,6) |
0,95 |
0,98 (0,59-1,64) |
|
Wide (>4,3 mm) |
10 (5,7) |
165 (94,3) |
0,28 |
01,53 (0,71-3,34) |
|
Implant length |
|
|
|
|
|
Short (<10 mm) |
37 (7,7) |
446 (92,3) |
|
1 |
|
Medium (10-11,5 mm) |
52 (4,9) |
1019 (95,1) |
0,10 |
0,69 (0,44-1,07) |
|
Long (>11,5 mm) |
19 (6,4) |
279 (93,6) |
0,10 |
0,57 (0,30-1,12) |
|
Implant brand |
|
|
|
|
|
Ritter |
22 (15,0) |
125 (85,0) |
|
1 |
|
Nobel |
40 (5,6) |
673 (94,4) |
0,002 |
0,41 (0,24-0,72) |
|
MIS |
18 (4,5) |
382 (95,5) |
<0,001 |
0,32 (0,17-0,57) |
|
Dentis |
4 (9,1) |
40 (90,9) |
0,32 |
0,58 (0,20-1,69) |
|
Hitech |
1 (2,0) |
50 (98,0) |
0,07 |
0,15 (0,02-1,20) |
|
Straumann |
13 (7,9) |
152 (92,1) |
0,055 |
0,51 (0,25-1,01) |
|
Osstem |
6 (3,3) |
178 (96,7) |
0,001 |
0,19 (0,07-0,49) |
|
Neo |
4 (2,7) |
144 (97,3) |
0,004 |
0,18 (0,06-0,57) |
|
Bone augmentation |
|
|
|
|
|
No |
63 (5,2) |
1158 (94,8) |
|
1 |
|
Yes |
45 (7,1) |
586 (92,9) |
0,25 |
1,60 (0,72-3,60) |
|
Barrier membrane augmentation |
|
|
|
|
|
No |
66 (5,0) |
1268 (95,0) |
|
1 |
|
Yes |
42 (8,1) |
476 (91,9) |
0,58 |
0,76 (0,27-2,05) |
|
Internal sinus lift |
|
|
|
|
|
No |
99 (5,6) |
1668 (94,4) |
|
1 |
|
Yes |
9 (10,6) |
76 (89,4) |
0,53 |
1,40 (0,49-3,92) |
Discussion
The inadequate osseointegration has considered being the reason for early implant failure [3-6]. Many clinical studies have been conducted to identify the risk factors: implant features (width, length, surface, shape, etc), bone quality and quantity, systemic factors such as smoking habit, metabolic disorders, and surgical-related factors (bone graft, flap/flapless, insertion torque, drilling protocol, etc) [4, 6]. Our study combined those factors and implant brand names in an analysis which helps clinicians to weigh the role of risk factors associated with early dental implant failure. The number of studies that compare results of different implant firms have still been limited while an increasing number of dental implant firms appeared in the market which make dentists confused. Besides, GEE was utilized, so that a patient was analysed as the statistical unit and the bias in p-value computation can be reduced. The reason is some risk factors should be considered in each individual condition instead of in each implant placement.
Analysis of our study showed that the early dental implant failure is higher than the late failure (5.58% and 0.52% for implant-based analysis, respectively). A previous study of Derk et al. reported that the late implant loss has a higher rate after 9 years follow up [7, 8]. This difference can be explained by the short follow-up time in this study and not enough information to evaluate all cases of late-stage implant failure.
The risk of implant failure among men is 1.57 times higher than for women (Table 5). These results can be explained by the higher smoking rates and less attention on oral hygiene of man and presented similarly to the research of Olmedo-Gaya et al. (2016), Grisar et al. (2017) [9, 10]. However, whether gender can affect implant failure is still currently controversial. Several studies reported that sex is not associated with early and late failures, while Andersen et al. (2013) demonstrated that women have a significant effect on implant failure rates [8, 11-13]. There are many different opinions about the correlation between implant size and implant success rate. This study showed no significant difference between implant diameters of implant loss rate (Table 5). The results are similar to those of Pieri et al. (2017), although small-diameter implants were proved to have a higher risk of complications [14]. Implant length is also not a risk factor for early dental implant failure (Table 5), similar to Lin et al. (2018) results, while Grisar et al. (2017) concluded that implant diameters were associated with early implant failure [9, 15].
Some studies have reported that maxillary implant placement is a significant risk factor [6, 13, 16]. Our results supported the finding that implant placement in the posterior maxillary area has a higher early failure risk with the odd ratios is 1.89 (confident interval 95% of 1,21-2,96) and p=0.001. The lower bone density can be a reason to explain why this happened. The presence of poor bone volume in the anterior site can make this area having a higher risk of failure than posterior site. However, there is no consensus in the literature as many studies proved that posterior, which usually has thinner cortical bone layer and withstands heavier occlusal force, has significantly more implant failure [16]. There was no correlation between the number of implants per patient and early implant failure in our study. This result is identical to the study of Guofen Lin et al. (2018) [15]. The inconsistency with the results of Chrcanovic et al. (2017), Jemt et al. (2017), possibly due to the lack of periodontal variables or smoking in our model [17, 18]. Although factors associated with surgical procedure such as bone grafting, barrier membrane, internal sinus lift, and external sinus lift led to prolonged surgery time and increased risk of infection, this study found no relation between the above factors with early implant failure. This result is consistent with studies of Hasegawa et al. (2017), Zinser et al. (2013), while several studies have shown the opposite results [10, 19-21].
There are no implant loss cases of Revois and Dentium brand so that the processing software automatically removed these two brands in regression analysis. The remaining 1852 implants was included in multivariate analysis. The results showed that the implant of Nobel, MIS, Osstem, Neo firms had significantly less failure than other brands. This information brings new information for clinicians due to the fact that only a few studies assess whether implant brands influence implant failure. In addition, there are many studies that have found no significant difference between implant brand and early or late implant failure [9, 22, 23].
Conclusion
Within the limitation of this clinical study, we found that the implant failure rate was 6.1% in which early failure accounted for 91.5%. Men and maxillary area (when compared to the posterior mandibular teeth) have statistically higher risk of early dental implant failure. Implant brands which have significantly less early failure rates are Ritter, Nobel, MIS, Osstem, Neo.
Article Info
Article Type
Research ArticlePublication history
Received: Mon 07, Sep 2020Accepted: Tue 22, Sep 2020
Published: Wed 24, Feb 2021
Copyright
© 2023 Ha Nguyen Thi Khanh. This is an open-access article distributed under the terms of the Creative Commons Attribution License, which permits unrestricted use, distribution, and reproduction in any medium, provided the original author and source are credited. Hosting by Science Repository.DOI: 10.31487/j.DOBCR.2020.04.08
Figures & Tables
Table
1: Baseline information (n=892).
|
Independent variables |
Frequency (n) |
Proportion (%) |
|
Age |
Mean ± SD 48.3±14.1 |
Min-Max 18-84 |
|
≤40 years old |
289 |
32,4 |
|
41-60 years old |
427 |
47,9 |
|
>60 years old |
176 |
19,7 |
|
Gender |
|
|
|
Female |
443 |
49,7 |
|
Male |
449 |
50,3 |
|
Systemic
disease |
||
|
No |
801 |
89,8 |
|
Yes |
91 |
10.2 |
|
Implant site |
|
|
|
Anterior maxilla |
365 |
18,9 |
|
Posterior maxilla |
500 |
25,9 |
|
Anterior mandibular |
97 |
5,0 |
|
Posterior mandibular |
969 |
50,2 |
|
Implant diameter |
||
|
Narrow (<3,75 mm) |
654 |
33,9 |
|
Medium (3,75-4,3 mm) |
1095 |
56,7 |
|
Wide (>4,3 mm) |
182 |
9,4 |
|
Implant length |
|
|
|
Short (<10 mm) |
514 |
26,6 |
|
Medium (10-11,5 mm) |
1106 |
57,3 |
|
Long (>11,5 mm) |
311 |
16,1 |
|
Implant brand-name |
||
|
Nobel Conical Connection |
477 |
24,7 |
|
Nobel Active |
236 |
12,2 |
|
MIS |
401 |
20,8 |
|
Dentis |
46 |
2,4 |
|
Hitech |
51 |
2,6 |
|
Revois |
54 |
2,8 |
|
Straumann |
29 |
1,5 |
|
Straumann Active |
137 |
7,1 |
|
Osstem |
137 |
7,1 |
|
Osstem Active |
47 |
2,4 |
|
Dentium |
15 |
0,8 |
|
Ritter |
150 |
7,8 |
|
Neo |
151 |
7,8 |
Table 2:
Accompanying systemic disorders (n=892).
|
Systemic disorders |
Frequency (n) |
Proportion (%) |
|
No |
801 |
89,8 |
|
Yes |
91 |
10.2 |
|
Name of disorder (n=91) |
|
|
|
High blood pressure |
53 |
58,2 |
|
Diabetes |
7 |
7,7 |
|
Cardiovascular disease |
8 |
8,8 |
|
High blood pressure + diabetes |
3 |
3,3 |
|
High blood pressure + cardiovascular disease |
3 |
3,3 |
|
High blood pressure + others |
3 |
3,3 |
|
High blood pressure + cardiovascular disease + diabetes |
2 |
2,2 |
|
Others |
12 |
13,2 |
Table 3:
Surgery-related variables (n=1931).
|
|
Frequency
(n) |
Proportion
(%) |
|
Bone augmentation |
|
|
|
No |
1278 |
66,2 |
|
Yes |
653 |
33,8 |
|
Barrier membrane |
|
|
|
No |
1394 |
72,2 |
|
Yes |
537 |
27,8 |
|
Immmediate dental implant placement |
|
|
|
No |
1719 |
89,0 |
|
Yes |
212 |
11,0 |
|
Internal sinus lift |
|
|
|
No |
1871 |
96,9 |
|
Yes |
60 |
3,1 |
|
Lateral sinus lift |
|
|
|
No |
1841 |
95,3 |
|
Yes |
90 |
4,7 |
Table 4:
Implant failure rate (n=1931).
|
|
Frequency
(n) |
Proportion
(%) |
|
Result of implant placement |
|
|
|
Failure rate |
118 |
6,1 |
|
Survival rate |
1813 |
93,9 |
|
Categories of implant failure (n=118) |
|
|
|
Early failure |
108 |
91,5 |
|
Late failure |
10 |
8,5 |
Table 5:
Distribution of implant failure by implant brand (n=1931).
|
|
Implant brand |
Frequency |
Follow-up (month) |
Total implant failure |
Early failure |
Late failure |
|
1 |
Nobel CC |
477 |
23.6±12.5 |
32 (6.7%) |
32 (6.7%) |
0 |
|
2 |
Nobel Active |
236 |
20.2±11.7 |
8 (3.4%) |
8 (3.4%) |
0 |
|
3 |
MIS |
401 |
20.9±11.0 |
19 (4,7%) |
18 (4,5%) |
1 (0,2) |
|
4 |
Dentis |
46 |
28.4±8.7 |
6 (13%) |
4 (8,7%) |
2 (4,3) |
|
5 |
Hitech |
51 |
30.6±10.0 |
1 (2,0%) |
1 (2,0%) |
0 |
|
6 |
Revois |
54 |
32.9±4.3 |
0 |
0 |
0 |
|
7 |
Straumann |
29 |
19.4±10.0 |
1 (3,4%) |
1 (3,4%) |
0 |
|
8 |
Straumann Active |
137 |
15.9±10.5 |
13 (9,5%) |
12 (8,8%) |
1 (0,7) |
|
9 |
Osstem |
137 |
17.3±5.5 |
4 (2,9%) |
4 (2,9%) |
0 |
|
10 |
Osstem Active |
47 |
15.4±5.0 |
2 (4,3%) |
2 (4,3%) |
0 |
|
11 |
Dentium |
15 |
15.6±10.4 |
0 |
0 |
0 |
|
12 |
Ritter |
150 |
14.8±6.9 |
25 (16,7%) |
22 (14,7%) |
3 (2,0) |
|
13 |
Neo |
151 |
14.2±10.5 |
7 (4,3%) |
4 (2,6%) |
3 (2,0) |
Table 6:
Multivariate risk factor analysis for early implant failure using GEE (n=1852).
|
Variables |
Result |
|
|
|
|
Failure n (%) |
Success n (%) |
p-value |
PR (CI 95%) |
|
|
Gender |
|
|
|
|
|
Female |
42(4,6) |
880 (95,4) |
|
1 |
|
Male |
66 (7,1) |
864 (92,9) |
0,02 |
1,57 (1,08-2,29) |
|
Implant site |
|
|
|
|
|
Posterior mandibular |
36 (3,88) |
893 (96,1) |
|
1 |
|
Anterior maxillary |
27 (7,7) |
336 (92,0) |
0,003 |
2,26 (1,32-3,86) |
|
Posterior maxillary |
39 (8,2) |
436 (91,8) |
0,005 |
1,89 (1,22-2,96) |
|
Anterior mandibular |
6 (6,3) |
89 (93,7) |
0,23 |
1,70 (0,72-4,06) |
|
Number of implant/patient |
|
|
|
|
|
1-2 implant |
49 (5,5) |
839 (94,5) |
|
1 |
|
3-4 implant |
27 (5,6) |
459 (94,4) |
0,88 |
0,96 (0,61-1,53) |
|
5-6 implant |
27 (10,3) |
236 (89,7) |
0,07 |
1,58 (0,98-2,57) |
|
> 6 implant |
5 (2,3) |
210 (97,7) |
0,07 |
0,43 (0,17-1,08) |
|
Implant diameter |
|
|
|
|
|
Narrow (<3,75 mm) |
32 (4,9) |
615 (95,1) |
|
1 |
|
Medium (3,75-4,3 mm) |
66 (6,4) |
964 (93,6) |
0,95 |
0,98 (0,59-1,64) |
|
Wide (>4,3 mm) |
10 (5,7) |
165 (94,3) |
0,28 |
01,53 (0,71-3,34) |
|
Implant length |
|
|
|
|
|
Short (<10 mm) |
37 (7,7) |
446 (92,3) |
|
1 |
|
Medium (10-11,5 mm) |
52 (4,9) |
1019 (95,1) |
0,10 |
0,69 (0,44-1,07) |
|
Long (>11,5 mm) |
19 (6,4) |
279 (93,6) |
0,10 |
0,57 (0,30-1,12) |
|
Implant brand |
|
|
|
|
|
Ritter |
22 (15,0) |
125 (85,0) |
|
1 |
|
Nobel |
40 (5,6) |
673 (94,4) |
0,002 |
0,41 (0,24-0,72) |
|
MIS |
18 (4,5) |
382 (95,5) |
<0,001 |
0,32 (0,17-0,57) |
|
Dentis |
4 (9,1) |
40 (90,9) |
0,32 |
0,58 (0,20-1,69) |
|
Hitech |
1 (2,0) |
50 (98,0) |
0,07 |
0,15 (0,02-1,20) |
|
Straumann |
13 (7,9) |
152 (92,1) |
0,055 |
0,51 (0,25-1,01) |
|
Osstem |
6 (3,3) |
178 (96,7) |
0,001 |
0,19 (0,07-0,49) |
|
Neo |
4 (2,7) |
144 (97,3) |
0,004 |
0,18 (0,06-0,57) |
|
Bone augmentation |
|
|
|
|
|
No |
63 (5,2) |
1158 (94,8) |
|
1 |
|
Yes |
45 (7,1) |
586 (92,9) |
0,25 |
1,60 (0,72-3,60) |
|
Barrier membrane augmentation |
|
|
|
|
|
No |
66 (5,0) |
1268 (95,0) |
|
1 |
|
Yes |
42 (8,1) |
476 (91,9) |
0,58 |
0,76 (0,27-2,05) |
|
Internal sinus lift |
|
|
|
|
|
No |
99 (5,6) |
1668 (94,4) |
|
1 |
|
Yes |
9 (10,6) |
76 (89,4) |
0,53 |
1,40 (0,49-3,92) |
References
1. Gupta R, Gupta N, Weber KK (2020) Dental Implants. In: StatPearls. Treasure Island (FL): StatPearls Publishing.
2. Esposito M, Hirsch JM, Lekholm U, Thomsen P (1998) Biological factors contributing to failures of osseointegrated oral implants. (I). Success criteria and epidemiology. Eur J Oral Sci 106: 527-551. [Crossref]
3. Berglundh T, Persson L, Klinge B (2002) A systematic review of the incidence of biological and technical complications in implant dentistry reported in prospective longitudinal studies of at least 5 years. J Clin Periodontol 29: s197-s212. [Crossref]
4. Klokkevold PR, Han TJ (2007) How do smoking, diabetes, and periodontitis affect outcomes of implant treatment? Int J Oral Maxillofac Implants 22: s173-s202. [Crossref]
5. Baqain ZH, Moqbel WY, Sawair FA (2012) Early dental implant failure: Risk factors. Br J Oral Maxillofac Surg 50: 239-243. [Crossref]
6. Manzano G, Montero J, Vallejo JM, Fabbro MD, Bravo M et al. (2016) Risk Factors in Early Implant Failure: A Meta-Analysis. Implant Dent 25: 272-280. [Crossref]
7. Derks J, Schaller D, Håkansson J, Wennström JL, Tomasi C et al. (2016) Effectiveness of Implant Therapy Analyzed in a Swedish Population: Prevalence of Peri-implantitis. J Dent Res 95: 43-49. [Crossref]
8. Derks J, Hakansson J, Wennström JL, Tomasi C, Larsson M et al. (2015) Effectiveness of implant therapy analyzed in a Swedish population: early and late implant loss. J Dent Res 94: 44S-51S. [Crossref]
9. Grisar K, Sinha D, Schoenaers J, Dormaar T, Politis C (2017) Retrospective Analysis of Dental Implants Placed Between 2012 and 2014: Indications, Risk Factors, and Early Survival. Int J Oral Maxillofac Implants 32: 649-654. [Crossref]
10. Olmedo Gaya MV, Manzano Moreno FJ, Cañaveral Cavero E, Castillo JDL, Vallecillo Capilla M (2016) Risk factors associated with early implant failure: A 5-year retrospective clinical study. J Prosthet Dent 115: 150-155. [Crossref]
11. Andersen OZ, Offermanns V, Sillassen M, Almtoft KP, Anderson IH et al. (2013) Accelerated bone ingrowth by local delivery of strontium from surface functionalized titanium implants. Biomaterials 34: 5883-5890. [Crossref]
12. Anitua E, Orive G, Aguirre JJ, Ardanza B, Andía I (2008) 5-year clinical experience with BTI dental implants: risk factors for implant failure. J Clin Periodontol 35: 724-732. [Crossref]
13. Noda K, Arakawa H, Ono AK, Yamazaki S, Hara ES et al. (2015) A longitudinal retrospective study of the analysis of the risk factors of implant failure by the application of generalized estimating equations. J Prosthodont Res 59: 178-184. [Crossref]
14. Pieri F, Forlivesi C, Caselli E, Corinaldesi G (2017) Narrow- (3.0 mm) Versus Standard-Diameter (4.0 and 4.5 mm) Implants for Splinted Partial Fixed Restoration of Posterior Mandibular and Maxillary Jaws: A 5-Year Retrospective Cohort Study. J Periodontol 88: 338-347. [Crossref]
15. Lin G, Ye S, Liu F, He F (2018) A retrospective study of 30,959 implants: Risk factors associated with early and late implant loss. J Clin Periodontol 45: 733-743. [Crossref]
16. Borba M, Deluiz D, Lourenço EJV, Oliveira L, Tannure PN (2017) Risk factors for implant failure: a retrospective study in an educational institution using GEE analyses. Braz Oral Res 31: e69. [Crossref]
17. Chrcanovic BR, Kisch J, Albrektsson T, Wennerberg A (2017) Analysis of risk factors for cluster behavior of dental implant failures. Clin Implant Dent Relat Res 19: 632-642. [Crossref]
18. Jemt T, Karouni M, Abitbol J, Zouiten O, Antoun H (2017) A retrospective study on 1592 consecutively performed operations in one private referral clinic. Part II: Peri- implantitis and implant failures. Clin Implant Dent Relat Res 19: 413-422. [Crossref]
19. Bornstein MM, Halbritter S, Harnisch H, Weber HP, Buser D (2008) A retrospective analysis of patients referred for implant placement to a specialty clinic: Indications, surgical procedures, and early failures. Int J Oral Maxillofac Implants 23: 1109-1116. [Crossref]
20. Hasegawa T, Kawabata S, Takeda D, Iwata E, Saito I et al. (2017) Survival of Branemark System Mk III implants and analysis of risk factors associated with implant failure. Int J Oral Maxillofac Surg 46: 267-273. [Crossref]
21. Zinser MJ, Randelzhofer P, Kuiper L, Zöller JE, Lange GLD (2013) The predictors of implant failure after maxillary sinus floor augmentation and reconstruction: A retrospective study of 1045 consecutive implants. Oral Surg Oral Med Oral Pathol Oral Radiol 115: 571-582. [Crossref]
22. Antoun H, Karouni M, Abitbol J, Zouiten O, Jemt T (2017) A retrospective study on 1592 consecutively performed operations in one private referral clinic. Part I: Early inflammation and early implant failures. Clin Implant Dent Relat Res 19: 404-412. [Crossref]
23. Chrcanovic BR, Kisch J, Albrektsson T, Wennerberg A (2016) Factors Influencing Early Dental Implant Failures. J Dent Res 95: 995-1002.[Crossref]