Sensitivity of Computer-Aided Detection (CAD) Device for Lung Nodule Detection on Chest Radiography: A Real-Life Application
A B S T R A C T
Purpose: The radiographic diagnosis of lung nodules is associated with low sensitivity and specificity. Computer-aided detection (CAD) system has been shown to have higher accuracy in the detection of lung nodules. The purpose of this study is to assess the effect on sensitivity and specificity when a CAD system is used to review chest radiographs in real-time setting.
Methods: Sixty-three patients, including 24 controls, who had chest radiographs and CT within three months were included in this study. Three radiologists were presented chest radiographs without CAD and were asked to mark all lung nodules. Then the radiologists were allowed to see the CAD region-of-interest (ROI) marks and were asked to agree or disagree with the marks. All marks were correlated with CT studies.
Results: The mean sensitivity of the three radiologists without CAD was 16.1%, which showed a statistically significant improvement to 22.5% with CAD. The mean specificity of the three radiologists was 52.5% without CAD and decreased to 48.1% with CAD. There was no significant change in the positive predictive value or negative predictive value.
Conclusion: The addition of a CAD system to chest radiography interpretation statistically improves the detection of lung nodules without affecting its specificity. Thus suggesting CAD would improve overall detection of lung nodules.
Keywords
Lung cancer, computer vision, computer aided detection, artificial intelligence
Introduction
Chest radiographs are extremely common studies, with numerous chest radiographs being performed in the United States each year [1]. Chest radiographs are frequently used to detect lung nodules as well as other pulmonary disease processes [2]. Studies show that the ability of radiologists to detect lung nodules on radiographs is affected by factors such as nodule size, location, and anatomical obstruction of the nodule [3, 4]. So, it is of no surprise that nodule detection rates by radiologists have been shown to be quite low in some studies, and that many nodules are missed initially and can later be detected when viewing the radiographs retrospectively [3, 5-8]. So despite the abundance of chest radiographs being performed, a great number of lung nodules do continue to go undetected. This presents a problem because these undetected nodules could potentially be malignant in nature, making their early detection imperative to the ultimate clinical outcome of the patients [9].
Thoracic radiographs continue to be used as the primary imaging study of the chest despite this known deficiency in nodule detection because they are inexpensive, can be rapidly and conveniently performed, and have low radiation exposure when compared to CT scans. Fortunately, there are various imaging methods that are utilized to enhance radiologists’ detection of pulmonary nodules on radiographs. Such imaging methods include Dual Energy Subtraction, Temporal Subtraction, and Digital Tomosynthesis [10-18].
Computer Aided Detection (CAD) systems are another promising technology that may potentially be helpful in the detection of lung nodules [19-29]. The purpose of the CAD system is to act as a second reader directing the radiologists’ attention to possible worrisome areas on the chest radiographs that could represent cancer, thus increasing the radiologist’s detection of nodules. In order for the CAD system to be most effective, the CAD false positive rate must be as low as possible so that the specificity is not diminished. In a previous study, we investigated the sensitivity and specificity of a CAD system alone and when a radiologist interacted with the CAD system [28]. The focus of this study is to determine if there is truly an improvement in the radiologists’ baseline sensitivity in detecting small lung nodules when they interact with a CAD system, and also to evaluate the effect that CAD has on the radiologists’ baseline specificity.
Material and Methods
Two view chest radiograph performed from June 2007 through August 2009 were reviewed. All patients who had a record of CT performed within a three-month time frame were included in this study. Any patient who did not have a dedicated CT of the chest during that timeframe was excluded from the study. The reports for all CT scans were reviewed for the presence of pulmonary nodules. Pulmonary nodules less than 8 mm or greater than 15 mm were excluded from the study. All CT scans were validated by the consensus. Using this criteria, there was a total of 64 patients that could be included in this study. We additionally excluded patients with greater than or equal to 4 pulmonary nodules. The remaining 39 patients were included in the study. Additionally, 24 control patients, patients who had no pulmonary nodules seen by CT, were included in this cohort. All PA chest x-rays were manually sent to an FDA approved chest radiograph CAD system (IQQA Chest v2.0 EDDA Technology, Princeton, NJ) as DICOM image. All 63 patients were included in this study regardless of age or image quality and all cases yielded a CAD result. This cohort included ED, inpatient and outpatient. All chest radiographs were exposed at 100 kV with a 10:1 grid and were obtained using a computed radiography system (FCR 9501, Fuji Photo Film, Tokyo, Japan). The imaging plate (ST-V, Fuji Photo Film) was 35 x43 cm (matrix size, 1,760 x 2,140; gray level, 10 bit; pixel size, 200 μm). The CAD system allows the radiologist to fully interact with the CAD results in a DICOM full resolution image displayed on the PACS system, (Dynamic Imaging, Princeton, NJ) which is overlaid on the monitor.
The CT scans were all performed on GE Lightspeed 16 or 64 detector CT, (GE Medical Systems, Milwaukee, WI) each CT was reviewed in lung windows (center -500, window 1500) at 1.25 mm thickness without overlap. Images were displayed on a Dome Monitor (Beaverton, OR, USA) with 1536 by 2048 pixel resolution. Exact parameters varied slightly as smart mA® was used on all patient, however, all studies included 1.25 mm thickness images continuously through the entire lung parenchyma. The average mA was in the 150-300 range, dependent on patient size. All kVp were set to 120. The detector configuration was 16 x 1.25mm or 64 x 0.625 with a pitch of 1:1.375, with a table speed of 10 mm/second, 0.5 second rotation times used in all cases. Noise index was set of 14.1. All imaging studies were performed from the apex of the lung to lung base.
All chest radiographs were independently shown to three different radiologists. Each of these radiologists has multiple years of experience reading chest radiographs, (from 12 to 25 years). Additionally, each has several years experience with the CAD device used in this study. The radiologist was first presented a PA view of the chest only without CAD.
The radiologist was allowed to determine if any nodules were present. A region of interest was marked on each possible nodule. Then, the radiologist was given the CAD results. The radiologist was asked to determine if a CAD region of interest represented a false positive or a true positive. For each region of interest (ROI) the radiologist could either accept or reject the ROI, this information was recorded. Controls were randomly distributed throughout the view sessions to decrease potential Hawthorne effect. The radiologists were aware of the purpose of the study and they were also aware that controls were included in the cohort.
The reference standard used in this study was the presence of a pulmonary nodule on CT. The chest radiographs were not assessed prior to the study to determine if the nodule could be seen. A true positive result was defined as correlation of a region of interest determined by the radiologist or CAD with the position of a pulmonary nodule on CT. A true negative result was defined as absence of pulmonary nodules on chest radiography and CT and neither CAD nor the radiologist marked a region of interest. A false positive result was defined as when a region of interest was marked by the radiologist or CAD that had no correlative pulmonary nodule on CT. A false negative result was defined as the presence of a pulmonary nodule on CT when no region of interest was marked by the radiologist or CAD on the chest radiograph.
As in prior studies, a nodule was defined by CT as a localized area of increased density; airspace disease and scars were not considered nodules [1]. All nodules found by CT were determined by the interpreting radiologist, all pulmonary nodules were verified by consensus. The net CAD effect was calculated for all readers and for the mean of the readers. The net CAD effect is defined as: change in sensitivity + {change in specificity (1/weighting factor) [(1 – probability of disease)/probability of disease]}. The weighting factor is defined as the relative increase in value of an additional correctly identified patient with a true-positive diagnosis compared with the reduction in value of an additional patient with a false-positive diagnosis [30]. We assumed a weighting factor of 3.
Statistical analysis including sensitivity, specificity, negative predictive value, positive predictive value calculation and t-test was used to determine difference using WinSTAT® for Microsoft® Excel version 2006.1. This retrospective study was approved by our institutional IRB.
Sample Case
60-year-old female with extensive smoking history is referred for a chest radiograph because of chronic cough (Figure 1).
Results
I Participants
A total of 45 nodules were included in this cohort of 39 patients. The mean size of the nodules was 10.8 mm (± 2.8 mm). There was no statistically significant correlation, (by Spearman Rank correlation) between nodule size and the detection of pulmonary nodules by any of the radiologists or by CAD (p>0.05).
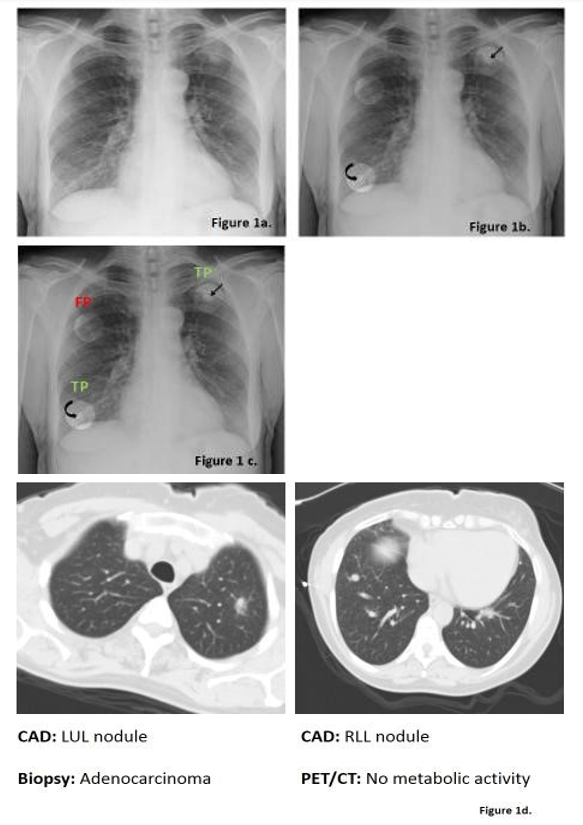
Figure 1: Figure 1a shows the initial PA chest radiograph shown to all three radiologists without CAD. If a possible nodule was detected by a radiologist, it was marked with a region of interest (ROI). Next, the radiologist was presented with CAD-detect ROIs (Figure 1b). Radiologists determined if the ROI represented a true positive lung nodule (TP) or false positive (FP) from artifact (Figure 1c). Figure 1d showed both of these nodules on CT. The third ROI identified by CAD was rejected by all three readers and was a false positive resulting from summation of shadows.
II Radiologists without CAD
The sensitivity of the individual radiologist without the use of CAD varied from 4.9% to a maximum 27.9% with a mean sensitivity of 16.1%. The specificity of the individual radiologists varied from 36.2% to a maximum of 75.7% with a mean specificity of 52.5%. The positive predictive value varied from 9.5% to 46.7% with a mean of 26.9%. The negative predictive value varied from 35% to a maximum of 39.1% with a mean of 36.6%.
III Radiologists with the CAD
The sensitivity of the individual radiologist improved with the use of CAD to a minimum of 16.3% and a maximum of 34.8% with a mean of 22.5%, this difference was found a statistically significant by t-test (p<0.05). The specificity of the individual radiologist with the use of CAD slightly decreased varying from 32.1% to a maximum of 75.7% with a mean of 48.1%. This difference was not found to be statistically significantly different (p>0.05). The positive predictive value improved slightly and ranged from 22.6% to a maximum of 46.7% with a mean of 29.9% this difference was not statistically significant (p>0.05). The negative predictive value also improved slightly ranging from 36.8% to a maximum of 40.9% with a mean of 38.6% this was not statistically significant different (p>0.05); (Table 1).

Table 1: Mean Performance of Radiologist without and with the Use of CAD.
IV CAD Results
There was an average of 1.1 false positive ROIs per case. The sensitivity of the CAD was 30.2%, with a specificity of 10.1%. All readers improved with the use of CAD. Each reader’s sensitivity improved with the addition any other reader. The radiologist accepted 8 additional ROIs which were true positive nodules, thus improving their sensitivity. However, the readers did not accept between 4, 7 and 10 ROIs respectively which were true nodules. The likelihood that a true positive CAD result would be dismissed by the reader increased with increasing years of experience. Interobserver agreement was poor with a kappa of 0.2. The net CAD effect for all readers which is defined by the net change in sensitivity and specificity related to CAD was 5.5% (CI +/-4.5) [30]. All readers had positive net CAD effects, see (Table 2), with only one reader having a 95% confidence interval that extended below zero.

Table 2: Net CAD effect.
Discussion
We found a statistically significant improvement in the sensitivity to detection of lung nodules when a computer aided detection system was utilized by three radiologists. There was no significant change in the specificity, negative predictive value nor positive predictive value. We found poor interobserver agreement in this study. Independently, the CAD system performed well with a sensitivity of 30.2%, however, the specificity was low, as expected at 10.1%. The false positive rate was low averaging 1.1 false positive ROIs per case.
The sensitivity measurements in this study are low. However, since the reference standard of CT was used we would expect a lower sensitivity. Nodules were not excluded if they were not well seen on chest radiographs. Therefore, this study represents the actual sensitivity of chest radiographs to the detection of pulmonary nodules. This study shows that there is a statistically significant improvement in sensitivity when a radiologist uses the CAD system, without a penalty to specificity. This suggests that this system would be potentially beneficial to a radiologist reading chest radiographs. The sensitivity reported here are similar to those seen in similarly designed studies [3, 5, 31].
Additionally, the net CAD effect for all readers was 5.5% (+/- 4.5 95% CI). Thus, in a series of 200 patients (with an estimated 122 nodules based on the prevalence of nodules in this study) the average reader would find an additional 8 pulmonary nodules at the cost of an additional 3 false positives. Initially, this may appear as a small increase in detection of true positive nodules; however, given the high volume of chest radiographs obtained, assistance with CAD can help in detecting a large number of true positive nodules which otherwise would have been missed. Further the 95% confidence interval for the CAD effect does not cross zero, suggesting that there is truly a benefit to the use of CAD. In screening mammography studies an increase in sensitivity is rated by patients 150-500 times more important than a corresponding loss of specificity [32, 33]. This suggests that patients place high emphasis on improved sensitivity of diagnostic tests.
Limitations of this study include the small number of patients. Additionally, only nodules between the sizes of 8 mm and 15 mm were included in this study. Other studies have included larger nodules and have obtained much higher sensitivity and specificity. The false positive rate is higher than in prior studies however, the mean of 1.1 false positives per case is an acceptable range for CAD [28]. The population study is limited especially given the patient population care for this institution which includes a large number of cancer patients. Another potential limitation of this study is the use of CT as the reference standard. Although the reference standard of CT is excellent, and the imaging parameters used in this study allow for careful examination of the CT slices, the sensitivity of CT for the diagnosis of pulmonary nodules has been reported as low as 74% [34].
Conclusion
CAD device did improve the sensitivity of the interpreting radiologists’ detection of a nodule on chest radiography. Given the extremely high number of the chest radiographs that continue be performed, there will likely be a significant benefit to the use of this type of a system. However, given the current data it is unlikely that chest radiography detection of small pulmonary nodules will ever reach a similar detection rate as seen by CT.
Article Info
Article Type
Research ArticlePublication history
Received: Thu 14, May 2020Accepted: Mon 01, Jun 2020
Published: Tue 09, Jun 2020
Copyright
© 2023 Ammar Chaudhry. This is an open-access article distributed under the terms of the Creative Commons Attribution License, which permits unrestricted use, distribution, and reproduction in any medium, provided the original author and source are credited. Hosting by Science Repository.DOI: 10.31487/j.RDI.2020.02.05
Figures & Tables
Table 1: Mean Performance of Radiologist without and with the Use of CAD.
References
- National Institutes of Standards and Technology, an agency of the U.S. Commerce Department’s Technology Administration.
- McLoud TC, Davis SD, Aquino SD, Batra PV, Goodman PC et al. (2006) Expert Panel on Thoracic Imaging. Routine admission and preoperative chest radiography. Reston (VA): Am Coll Radiol (ACR).
- Kelsey CA, Moseley RD, Brogdon BG, Bhave DG, Hallberg J et al. (1977) Effect of Size and Position on Chest Lesion Detection. AJR Am J Roentgenol 129: 205-208. [Crossref]
- Samei E, Flynn MJ, Peterson E, Eyler WR (2003) Subtle Lung Nodules: Influence of Local Anatomic Variations on Detection. Radiology 228: 76-84. [Crossref]
- Wu N, Gamsu G, Czum J, Held B, Thakur R et al. (2006) Detection of Small Pulmonary Nodules using Direct Digital Radiography and Picture Archiving and Communication Systems. J Thorac Imaging 21: 27-31. [Crossref]
- Austin JH, Romney BM, Goldmith LS (1992) Missed bronchogenic carcinoma: radiographic findings in 27 patients with a potentially resectable lesion evident in retrospect. Radiology 182: 115-122. [Crossref]
- Muhm JR, Miller WE, Fontana RS, Sanderson DR, Uhlenhopp MA (1983) Lung Cancer Detected During a Screening Program Using Four-Month Chest Radiographs. Radiology 148: 609-615. [Crossref]
- Quekel LG, Kessels AG, Goei R, van Engelshoven JM (1999) Miss Rate of Lung Cancer on the Chest Radiograph in Clinical Practice. Chest 115: 720-724. [Crossref]
- The international Early Lung cancer Action program Investigators, Henschke CI, Yankelevitz DF, Libby DF et al. (2006) Survival of Patients With Stage I Lung Cancer Detected on CT Screening. N Engl J Med 355: 1763-1771. [Crossref]
- Szucs Farkas Z, Patak MA, Yuksel Hatz S, Ruder T, Vock P (2008) Single-exposure Dual-Energy Subtraction Chest Radiography: Detection of Pulmonary Nodules and Masses in Clinical Practice. Eur Radiol 18: 24-31. [Crossref]
- Fischbach F, Freund T, Rottgen R, Engert U, Felix R et al. (2003) Dual-energy Chest Radiography With a Flat-Panel Digital Detector: Revealing Calcified Chest Abnormalities. AJR Am J Roentgenol 181: 1519-1524. [Crossref]
- Ricke J, Fischbach F, Freund T, Teichgraber U, Hanninen EL et al. (2003) Clinical Results of CsI-detector-based Dual-Exposure Dual Energy in Chest Radiography. Eur Radiol 13: 2577-2582. [Crossref]
- Difazio M, MacMahon H, Xu XW, Tsai P, Shiraishi J et al. (1997) Digital Chest Radiography: Effect of Temporal Subtraction Images on Detection Accuracy. Radiology 202: 447-452. [Crossref]
- Kakeda S, Nakamura K, Kamada K, Watanabe H, Nakata H et al. (2002) Improved Detection of Lung Nodules by Using a Temporal Subtraction Technique. Radiology 224: 145-151. [Crossref]
- Kakeda S, Kamada K, Hatakeyama Y, Aoki T, Korogi Y et al. (2006) Effect of Temporal Subtraction Technique on Interpretation Time and Diagnostic Accuracy of Chest Radiography. AJR Am J Roentgenol 187: 1253-1259. [Crossref]
- Dobbins JT, McAdams HP, Song JW, Li CM, Godfrey DJ et al. (2008) Digital Tomosynthesis of the Chest for Lung Nodule Detection: Interim Sensitivity Results From an Ongoing NIH-sponsored Trial. Med Phys 35: 2554-2557. [Crossref]
- Sone S, Kasuga T, Sakai F, Oguchi K, Itoh A et al. (1996) Digital Tomosynthesis Imaging of the Lung. Radiat Med 14: 53-63. [Crossref]
- Vikgren J, Zachrisson S, Svalkvist A, Johnsson ÅA, Boijsen M et al. (2008) Comparison of Chest Tomosynthesis and Chest Radiography for Detection of Pulmonary Nodules: Human Observer Study of Clinical Cases. Radiology 249: 1034-1041. [Crossref]
- Kakeda S, Moriya J, Sato H, Aoki T, Watanabe H et al. (2004) Improved Detection of Lung Nodules on Chest Radiographs Using a Commercial Computer-Aided Diagnosis System. AJR Am J Roentgenol 182: 505-510. [Crossref]
- Giger ML, Doi K, MacMahon H, Metz CE, Yin FF (1990) Pulmonary Nodules: Computer-Aided Detection in Digital Chest Images. Radiographics 10: 41-51. [Crossref]
- Kobayashi T, Xu XW, MacMahon H, Metz CE, Doi K (1996) Effect of a Computer-Aided Diagnosis Scheme on Radiologists' Performance in Detection of Lung Nodules on Radiographs. Radiology 199: 843-848. [Crossref]
- Reeves AP, Kostis WJ (2000) Computer-aided Diagnosis for Lung Cancer. Radiol Clin North Am 38: 497-509. [Crossref]
- Freedman MT, Lo SCB, Lure F, (2001) Computer aided detection of lung cancer on chest radiographs: algorithm performance vs. radiologists’ performance by size of cancer. Prop SPIE 4319: 150-159.
- Freedman MT, Lo SCB, Osicka T (2002) Computer-aided detection of lung cancer on chest radiographs: effect of machine CAD false-positive locations on radiologists’ behavior. Prop SPIE 2002: 1311-1319.
- Giger ML, Doi K, MacMahon H (1988) Image Feature Analysis and Computer-Aided Diagnosis in Digital Radiography. 3. Automated Detection of Nodules in Peripheral Lung Fields. Med Phys 15: 158-166. [Crossref]
- Jin Z, Ma D, Song W, Fan L (2005) Improving radiological interpretation of chest digital radiograph images using a real-time interactive pulmonary nodule analysis system: a cross-center study, RSNA, Chicago.
- van Beek E, Mullan B, Thompson B (2006) Evaluation of a real-time interactive pulmonary nodule analysis system on chest digital radiographic images: a prospective study, RSNA, Chicago.
- Moore W, Ripton Synder J, Wu G, Hendler C (2010) Sensitivity and Specificity of a CAD Solution for Lung Nodule Detection on Chest Radiograph with CTA Correlation. J Digit Imaging 24: 405-410. [Crossref]
- van Beek ERJ, Mullan B, Thompson B (2008) Evaluation of a real-time interactive pulmonary nodule analysis system on chest digital radiographic studies: a prospective study. Acad Radiol 15: 571-575.
- Halligan S, Mallet S, Altman DG, McQuillan J, Proud M et al. (2011) Incremental Benefit of Computer-Aided Detection When Used as a Second and Concurrent Reader of CT Colonographic Data: Multiobserver Study. Radiology 258: 469-476. [Crossref]
- De Boo DW, Prokop M, Uffmann M, van Ginneken B, Schaefer Prokop CM (2009) Computer-aided Detection (CAD) of Lung Nodules and Small Tumours on Chest Radiographs. Eur J Radiol 72: 218-225. [Crossref]
- Wagner RF, Beam CA, Beiden SV (2004) Reader Variability in Mammography and Its Implications for Expected Utility Over the Population of Readers and Cases. Med Decis Making 24: 561-572. [Crossref]
- Pencina MJ, D’Agostino RB Sr, D’Agostino RB Jr, Vasan RS (2008) Evaluating the Added Predictive Ability of a New Marker: From Area Under the ROC Curve to Reclassification and Beyond. Stat Med 27: 157-172. [Crossref]
- Swensen SJ, Jett JR, Sloan JA, Midthun DE, Hartman TE et al. (2002) Screening for Lung Cancer With Low-Dose Spiral Computed Tomography. Am J Respir Crit Care Med 165: 508-513. [Crossref]