Journals
Sono and photo stimulated Chlorine E6 nanocomposite in tumor-bearing mice: upcoming cancer treatment
A B S T R A C T
This study was directed at study the effectiveness of cancer targeted therapy using the activated Chlorine E6 nanocomposite (Nano-CE6). Study was applied on male Swiss albino mice, implanted with Ehrlich tumor (EAC) divided into six groups. Two energy sources were used; laser and Ultrasound. Results showed that Nano-CE6 is a potential sensitizer for photodynamic or sonodynamic treatment of tumor. Nano-CE6 plays an important role in tumor growth inhibition and cell death induction. Activated Nano-CE6 with both infrared laser and ultrasound has a potential antitumor effect. The results indicated that (FA–NGO–CE6) could be used as a unique nanocomposite for cancer targeted therapy SPDT.
Keywords
Nano-Chlorine E6,ehrlich tumor,sonodynamic therapy,photodynamic therapy
Introduction
Cancer is a class of diseases depict by abnormal cell growth that can spread throughout the body. Cancer is a disease that is difficult to treat, contain, and identify ]1, 2.[ There are many different ways for treating cancer, the most commonly used in cancer treatments are surgery, chemotherapy, radiotherapy or combination of the three, all of which have shown significant improvements in cancer treatments. Despite these improvements, surgery, when possible, continues to offer the best results however, cancer is usually detected at late stages when the disease has already spread, limiting surgery-based treatments mostly to early cancers. Chemotherapy and radiation therapy often fall short and have higher cancer relapse rates. This has encouraged many researchers to focus on trying to create new medical therapies to make cancer treatment less painful and more effective which would make the treatments less stressful for the patient ]3, 4[. In recent years, there has been increasing interest in using of photodynamic therapy [PDT] to treat different types of cancers, either on its own or in combination with other anticancer treatment methods. PDT involve the administration of a photosensitizing (PS) drug and subsequently illuminating the target area with light corresponding to the absorbance wavelength of the PS, triggering a series of biological effects [5-8]. Sonodynamic therapy [SDT] has been raised as a promising noninvasive approach derived from PDT. The low penetration depth of light, PDT is not effective for the treatment of deep tumors. A great advantage of SDT on a PDT is that it can penetrate soft tissue up to tens of centimeters therefore; SDT overcomes the limitation of PDT [9-12].
Sono-photodynamic therapy [SPDT] is a new therapeutic method that utilizes a safe agent with sono and photo sensitive properties. PDT and SDT have been applied for years as separate processes for the treatment of cancer with variable results. PDT alone is used for more superficial tumor, but when combined with SDT, it has been shown to be efficient for deep-seated as well as metastatic tumors [13].
The aim of this work was to study the effectiveness of nano-Chlorine E6 in activated cancer-targeted therapy. To achieve our goal the following was done.
Materials and methods
Synthesis of nanographene oxide (NGO), conjugation of folic acid with nanographene oxide (FA-NGO) and photosensitizer Chlorine E6 loading on FA-NGO (FA-GO-CE6 ) according to Abd El-Kaream SA et al; (2018), In the present work Chlorine E6 was used as sonophotosensitizer; chemically active by absorption of light and/or ultrasound [14]. Chlorine E6 was purchased from Molbase Chemicals Co. India. The sonophotosensitizer obtained as powder stored in dark bottle at -20oC temperature and with Purity: 99.9% by HPLC analysis. CE6 was dissolved in a sterilized phosphate buffer saline solution with PH = 7.4 and mixed with FA-NGO (0.5 mg/mL) at room temperature for 24 h. The loading efficiency of CE6 was approved using UV absorbance at 663 nm. FA-NGO-CE6 administered to tumor-bearing mice intraperitoneally (IP) injection for 15 days 18-20 hours before exposure to either photo and/or sonodynamic treatment modality.
Experimental design and tumor implantation
Study was conducted on One hundred and thirty male Swiss albino mice. Ehrlich ascites carcinoma tumor cells, 2 x 10⁶ human female mammary cells in origin, diluted approximately ten times in 0.9 % saline were inoculated subcutaneously on the left abdominal region of mice purchased from national cancer institute, cairo university. The animals were housed in plastic cages and were kept under natural light with diet and water at available. When tumors reach to 10 mm in diameter on day 10 after implantation, the treatment study was started. Use of experimental animals in the study protocol was carried out in accordance with the ethical guidelines of the medical research institute, alexandria university (Guiding Principles for Biomedical Research Involving Animals, 2011). Mice were grouped into the following: Group I: (30 mice); a) 10 mice: Control without tumor, b) 10 mice: Tumor bearing mice without treatment, c) 10 mice: Tumor bearing mice treated with (FA-NGO-CE6) only. Group II: (20 mice, laser irradiated group); a) 10 mice: were exposed to Infra-Red Laser, 4000Hz, for 3 minutes, b) 10 mice: were exposed to Infra-Red Laser, 7000Hz, for 3 minutes. Group III: (20 mice, ultrasound group); a) 10 mice: were exposed to pulsed ultrasound for 3 minutes, b) 10 mice: were exposed to continuous ultrasound for 3 minutes. Group IV: (20 mice, (FA-NGO-CE6), laser group); Tumor bearing mice of this group were injected (IP) with (FA-NGO-CE6), then the tumor sites were irradiated to laser light at same conditions of group II. Group V: (20 mice, (FA-NGO-CE6), ultrasound group); Tumor bearing mice of this group were injected (IP) with (FA-NGO-CE6), then were divided into 2 sub-groups. The tumor sites were irradiated to ultrasound at same conditions of group III. Group VI: (20 mice, combined treatment groups); a) 10 mice: were irradiated to laser light for 3 minutes, followed by ultrasound for 3 minutes, b) 10 mice: Injected (IP) with (FA-NGO-CE6), then tumor sites were irradiated to laser light (7000 Hz) for 3 min, followed by pulsed ultrasound for 3 minutes.
Laser/Ultrasound Exposure
For laser and/or ultrasound exposure, the mice were anesthetized with diethyl ether. The hair over the tumors was shaved off. The mice were fixed on a board with the tumor upwards. The probe was placed nearly on the tumor, which was irradiated with laser and/or ultrasound for 3 minutes at the different conditions as mentioned before. After PDT, SDT and SPDT, animals were maintained in the dark to avoid skin irritation. Exposure of mice tumor to the laser beam was carried out using an Infrared diode laser, model LAS 50- Hi-Tech fysiomed, Germany operated at a wavelength of 904 nm and a peak power of 50 W at a frequency up to 7000 Hz. Exposure of mice tumor to the continuous and pulsed ultrasound was carried out using an ultrasonic therapy instrument (Model CSl Shanghai, No. 822 Factory. China). This instrument uses electronic tube to generate an electric oscillation with frequency 0.8 MHz and power output which converted to ultrasonic mechanical energy by means of ultrasonic transducer (calcium zirconate –titanate). The mechanical ultrasonic energy has a beam power density which can be adjusted from 0.5 to 3W/cm2. This instrument operates at both continuous wave mode with output power from 0.5 - 3W/cm2 adjustable in 11 steps and pulsed mode (pulse frequency 1000 Hz, duty ratio 1/3 and average power density from 0.15-1 W/cm2). For evaluation of the treatment effects to all studied groups the following investigations were done:
Tumor growth / inhibition assay
During treatment session, tumor growth was examined regularly every day. Length and width of tumors were measured with a slide caliper and tumor volume (in mm3) was calculated by the use of the following equation. TV (mm3) = 22/7x4/3x (length/2) x (width/2)2 Two weeks after the treatment, the mice were sacrificed and the tumors were dissected out, weighed (in grams). The tumor volume growth ratio and tumor mass inhibition ratio were calculated as follows. TMIR=1- (average tumor weight of treated group / average tumor weight of control group) x100
Biochemical Examination
Blood sample (2.5 ml of venous blood) was withdrawn from all mice group. This blood samples were allowed to clot thoroughly for 20 minutes then centrifuged at 3000xg for 20 minutes for separating serum for biochemical examinations. All biochemical analysis was done on Indiko Plus Auto-analyzer.
Oxidative stress and antioxidant profile
Lipid peroxidation (MDA) assay kit (BioVision Catalog # K739-100), total antioxidant capacity (TAC) assay kit (BioVision Catalog #K274-100), glutathione reductase (GR) activity assay kit (BioVision Catalog #K761-100), glutathione-s-transferase (GST) activity assay kit (BioVision Catalog #K263-100), superoxide dismutase (SOD) activity assay kit (BioVision Catalog #K335-100), Catalase (CAT) activity assay kit (BioVision Catalog #K773-100), were used according to the manufacturer’s instructions.
Kidney and liver biomarkers
Urea (Sigma Catalog # MAK179), creatinine (Sigma Catalog # MAK080), Alanine Transaminase (ALT) Activity Assay Kit (Sigma Catalog # MAK052), Aspartate Aminotransferase (AST) Activity Assay Kit (Sigma Catalog #MAK055) and -Glutamyltransferase (GGT) Activity Assay Kit(Sigma Catalog #MAK089), were used according to the manufacturer’s instructions.
Molecular detection of fucosyltransferase-4 mRNA gene expression in excised tumor via RT-PCR
RNA was extracted from the Erich tumor of mice using QIAamp RNA tissue kit, was purchased from QIAGEN, USA according to the manufacturer’s instructions. Preparation of Full-Length First strand cDNA from RNA template using RevertAid TM First cDNA Strand Synthesis Kit. Reverse transcription reaction was carried out in a 20 µl reaction mixture by using RevertAid TM First cDNA Strand Synthesis Kit # K1621,#1622, was purchased from MBI Fermentas, Lithuania according to manufacturer's instruction. For amplification; to each PCR tube the following were added 5 µl (0.25 µg) Template fucosyltransferase-4 - cDNA, 10 µl Taq TM Green PCR Master Mix (2X) {dNTPs [0.4 mM of each dATP, dCTP, dGTP, dTTP], 0.05u/μl Taq DNA polymerase and reaction buffer} # k1081, was purchased from MBI Fermentas, Lithuania, 1.5 µl fucosyltransferase-4 forward primer: 5̛-TTGCAGCCTGCGCTTCAACATCAG-3̛, 1.5 µl fucosyltransferase-4 reverse primers: 5̛ -ACTCAGCTGGTGGTAGTAACGGAC-3̛ and deionized-RNase free water to final volume 20 µl. The reaction mixtures were gently vortexed, briefly centrifuged to collection all drops to the bottom of the tubes, then were placed in the thermal cycler (Little Genius, Bioer Co), The PCR mixture was subjected to 35 amplification cycles. PCR thermal profile was as follow: pre-denaturation (94°C, 2min), followed by 35 cycles of denaturation (94°C, 1min), annealing (52°C, 1min), and extension (72°C, 1min), with a final extension (72°C, 7min). To verify the successful preparation of mRNA and as positive controls, samples were detected for the presence of glyceraldehyde-3-phosphate dehydrogenase (GAPDH) mRNA. Forward primer: 5̛-AGGCCGGTGCTGAGTATGTC-3̛, reverse primers: 5̛-TGCCTGCTTCACCACCTTCT-3̛. Reaction tubes containing no cDNA control template and without cDNA sample addition were included as negative controls for each PCR reaction. For detection; Amplicons were analyzed with 2% (wt/vol) ethidium bromide stained agarose gel. The bands were visualized on a 302 nm UV transilluminator (BIO-RAD, USA).The gel was examined for bands of 343bp and 530bp as determined by the molecular weight marker (Gene Ruler TM 100bp DNA marker #SM0323, was purchased from Fermentas, Lithuania) runs at the same time and then photographed using a digital camera .
Histopathological examination
Small pieces of Ehrlich tumor tissue of the experimental groups were processed and examined by haematoxylin and eosin (H&E) method as follows; small pieces of Ehrlich Tumor tissues were fixed at 10% formaldehyde, dehydrated in ascending grades using alcohol, embedded in paraffin to produce paraffin block, the blocks were cut into 3-4 µm thick sections and floated in water bath, cleaned with xylene, rehydrated in descending grades of alcohol, stained with haematoxylin and eosin stain, cleaned again ethylene and covered by covering slides, thus the slides were prepared to be examined by light microscopy.
Statistical analysis of data
The findings were presented using one-way variance analysis (ANOVA). Results were expressed as mean ± standard deviation (SD) and values of P > 0.05 were considered non-significantly different, while values of P < 0.05 were assumed significant. F probability expresses the general effect between groups.
Figure 1: TEM of FA-GO-CE6 nanoparticle, UV-vis spectra of GO, FA-GO and FA-GO-CE6 and the effect of IRL at different frequencies, US continuous / pulsed and combined modalities on the tumor volume (mm3), of untreated and NCE6 treated groups
Figure 2: The effect of IRL at different frequencies, US continuous / pulsed and combined modalities on the tumor volume (mm3), of untreated and NCE6 treated groups during treatment period
Results
Treatment with Nano-CE6 without activation has little or no effect on tumor volume and tumor weight. Up to one week, all treatment modulates have little effect on the tumor volume and tumor weight. After one week, treatment with IRL and ultrasound (pulsed or continuous wave) in the presence or absence of Nano-CE6, become more effective. The presence of Nano-CE6 increases the effect of both IRL and ultrasound. Results obtained indicated that pulsed ultrasonic wave is more effective than continuous ultrasonic wave in the presences of Nano-CE6. Pulsed wave ultrasound at 3W/cm2 was selected to combine with IRL at 7000 Hz. This combined treatment modality is more effective on tumor cells than using of infrared laser (IRL) or ultrasound alone (Figure 1-3).
Oxidative stress and antioxidant profile
In our study, the increase in lipid peroxidation was reported in controlled group which carried EAC. In all the irradiated groups and that irradiated and treated without Nano-CE6, a significant increase in the levels of MDA was observed. Animals in groups irradiated with IRL or U.S or both with Nano-CE6 exhibited significantly low levels of MDA, as compared with the cancer control group or with treated mice without activation of Nano-CE6, (Figure 4). The same table, the implanted mice with EAC showed decreased activities of antioxidants (SOD, CAT, GR, GST and TAC) in comparison with normal animals. On the other hand, there is a significant increase in the enzymatic and non-enzymatic antioxidant guard in the groups irradiated with IRL or US or both with Nano-CE6 when compared with cancer control group or with treated mice without activation of Nano-CE6.
Kidney and liver biomarkers
The renal function tests, namely; creatinine and urea, were estimated. The EAC caused a significant increase in the serum urea and creatinine levels in the studied groups. On the other hand the Nano-CE6 caused decrease in the levels of serum creatinine and urea which is probably an indication of renal protection, (Figure 5). This also confirms the protective role of Nano-CE6 against renal toxicity. Also, the hepatic function tests, ALT, AST and GGT, were estimated. The EAC caused a significant increase in the serum activities of ALT, AST and GGT of the tumor treated groups. However, in the EAC treated groups with Nano-CE6 a decrease in serum levels of ALT, AST, and GGT, were observed which is an indication of the hepatoprotection by Nano-CE6, i.e., this confirms the protective role of Nano-CE6 against hepatotoxicity.
Histological Evaluation
The histological evaluation revealed that all tumors from the group of mice bearing tumor without treatment working as a control group were highly malignant cells and the tumors showed 5-10 % necrosis. Group of mice bearing tumor treated with (Nano-CE6) only the similar percentage as only EAC group due to Nano-CE6 inactivation, Group of mice bearing tumor treated with 4000Hz, 7000Hz IRL only, showed significant areas of necrosis (40- 55% respectively). In the group of mice injected IP with (Nano-CE6) then the tumor site was irradiated to 4000Hz, 7000Hz showed significant areas of necrosis (56-67% respectively). Group of mice bearing tumor treated with continuous and pulsed ultrasound showed significant areas of necrosis (55- 60% respectively).The group of mice injected IP with (Nano-CE6 ), then the tumor site was irradiated to continuous and pulsed ultrasound the areas of necrosis (65- 75% respectively), when compared with EAC untreated group. In case of two combination groups, mice bearing tumor treated 7000Hz followed by pulsed ultrasound only, and mice bearing tumor injected IP with (Nano-CE6 ) then tumor site was irradiated to 7000Hz, followed by pulsed ultrasound, large foci of necrosis areas (80-82% respectively) were present which were distinctly appeared (Figure 6).
Fucosyltransferase-4 gene expression
Amplification of fucosyltransferase-4 gene expression in breast tissues of all studied groups using RT-PCR is shown in Figure (7). PCR products were separated on 2% agarose gel electrophoresis. Products for fucosyltransferase-4 and GADPH gene expression were at 343 and 530bp respectively. Lane (a) is the molecular weight marker (50bp DNA ladder). All samples were positive to GADPH gene expression. Samples of lanes (1-3), lanes (4-6), lanes (7-9), and lanes (10-12) showed positive bands for fucosyltransferase-4 gene expression with different intensity; of EAC cancerous untreated group, EAC bearing group treated with laser, EAC bearing group treated with ultrasound, EAC bearing group treated with combined laser and ultrasound, respectively in presence of Nano-CE6.
Figure 3: The effect of IRL at different frequencies, US continuous / pulsed and combined modalities on the tumor volume (mm3), tumor volume growth rate (%), tumor volume inhibition ratio (%), tumor mass (gm), tumor mass growth rate (%), tumor mass inhibition ratio (%), of untreated and NCE6 treated groups. F: F value for ANOVA test (TV (mm3):15.929 p<0.001*, TM (gm):17.826 p<0.001*) a: Significant with EAC group b: Significant with NCE6 only group *: Statistically significant at p ≤ 0.05
Figure 4: The effect of IRL at different frequencies, US continuous / pulsed and combined modalities on antioxidants activities, capacities and MDA, of untreated and NCE6 treated groups. F: value for ANOVA test (GST (U/ml): 74820.533p<0.001*, GR (mU/ml): 123.732p<0.001*, CAT (mU/ml): 14262.200 p<0.001*, TAC (mM/L): 207094.2667p<0.001*, SOD (U/ml): 435475.152p<0.001* and MDA (nmol/ml): 26018.726 p<0.001*) a: Significant with Normal group b: Significant with EAC group c: Significant with NCE6’ group *: Statistically significant at p ≤ 0.05 Data was expressed by using mean ± SD.
Figure 5: The effect of IRL at different frequencies, US continuous / pulsed and combined modalities on renal and hepatic biomarkers, of untreated and NCE6 treated groups. F: value for ANOVA test (Urea (mg/dl): 0.836 p<0.001*, Creatinine (mg/dl): 1.567p<0.001*, ALT (U/l): 1921.624p<0.001*, AST (U/l): 90.512 p<0.001* and GGT (U/l): 0.425p<0.001*) a: Significant with Normal group b: Significant with EAC group c: Significant with NCE6 group *: Statistically significant at p ≤ 0.05 Data was expressed by using mean ± SD.

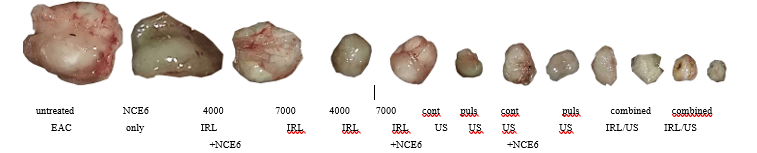
Figure 6: The effect of 1; untreated EAC implanted group without any treatment, 2; NCE6 treated group without activation, 3;4000 Hz IRL in absence of NCE6 , 4;7000 Hz IRL in absence of NCE6 , 5;4000 Hz IRL in presence of NCE6 , 6;7000 Hz IRL in presence of NCE6 , 7;continuous US in absence of NCE6 , 8;pulsed US in absence of NCE6 , 9;continuous US in presence of NCE6 , 10;pulsed US in presence of NCE6 , 11;Combined modalities IRL/US in absence of NCE6 and 12;Combined modalities IRL/US in presence of NCE6 on cellular level.

Figure 7: The effect of IRL at frequency (7000 Hz), pulsed US and combined modalities on gene level, of untreated and NCE6 treated groups.
Discussion
In the present work, Nano-CE6 as sono-photosensitizer, IR laser photodynamic therapy and sonodynamic therapy were employed to investigate whether alone or combined together, could be safely administered, provide an increased local tumor cytotoxic response and represents a promising approach in cancer therapy. The MDA level is used as an indicator of oxidative stress, indicating an increasing interest in studying the role that lipid peroxidation played in the development of cancer. A low-molecular-weight aldehyde MDA is generated from free radical attack on polyunsaturated fatty acids ]15, 16.[ The probable cause of a high level of serum lipid peroxide in cancer may be due to a defective antioxidant system that leads to accumulation of lipid peroxides in the cancerous tissues followed by secretion in the bloodstream [17]. MDA is a product of high-toxic cytotoxic aldehydes of lipid peroxidation. It is said to inhibit protective enzymes. Thus, they can have both mutagenic and carcinogenic effects [18.]
In our study, the increase in lipid peroxidation was recorded during EAC which known with its carcinogenicity. All groups injected with EAC, have a statistically significant elevation in the levels of MDA as compared to the control group animals. The inhibition of peroxidation by nano-CE6 is mainly attributed to the scavenging of the reactive free radicals involved in the peroxidation ]19.[Animals in groups injected with Nano-CE6 as a treatment showed significantly low levels of MDA, compared to animals not treated with Nano-CE6 . This verifies the anti-lipid peroxidative role of Nano-CE6 by its ability to scavenge free radical generation.
For the purpose of preventing cellular damage caused by ROS, there is a lot of antioxidant defense system. The antioxidant defense system may detect ROS, which plays an important role in the initiation of lipid peroxidation, thus playing a protective role in the development of cancer [20]. This defense system works through enzymatic (including SOD, GPx, GST and CAT) and non-enzymatic components (mainly GSH) [21, 22]. SOD is the basic step of the defense mechanism in an antioxidant system against oxidative stress, because it breaks down the superoxide anion (O2) into O2 and H2O2. Gpx and catalase can delete H2O2 and convert it to harmless by-products, thereby providing protection against ROS [23.]
Also, GPX has a high strength in neutralizing reactivated free radicals in response to oxidative stress and detoxification of peroxides and hydroperoxides that lead to GSH oxidation [24]. Moreover, GST stimulates the coupling of functional groups of GSH atoms to to electrophilic xenobiotics, leading to elimination or conversion of xenobiotic-GSH conjugate [25]. In such an interaction, GSH is oxidized into GSSG, which can be reduced to GSH by GR with NADPH consumption [26]. GSH is the most important non-enzymatic antioxidant in mammalian cells ]27.[ GSH is said to be involved in many cellular processes including detoxification of internal and external compounds and effectively protects cells against the harmful effects of oxidative stress by removing free radicals, removing H2O2, and suppressing lipid peroxidation [28].
In the present study, the EAC bearing mice showed decreased activities of antioxidants (SOD, CAT, GR, GST and TAC) in comparison with control animals. The present data are consistent with previous findings] 29, 30[. Pradeep et al. (2007) reported that such subsequent lower in the antioxidant defense is due to the low expression of these antioxidants during mammary gland damage [30]. On the other hand, there is a significant increase in the enzymatic and non-enzymatic antioxidant guard in the animals which carried the EAC when treated with Nano-CE6, US and /or IRL when compared to the control group. This increase is due to the ability of Nano-CE6 to prevent the formation of free radicals, enhance the endogenous antioxidant activity beyond its free radical scavenging property and the reduction of EAC lipoperoxide formation ]31.[ The increase in the activities of the antioxidant enzymes in the Nano-CE6 treated mice compared to control group indicates its effect] 32-41.[ In this work, a statistically significant negative correlation between antioxidant activities and plasma mean levels of MDA was observed. The increased MDA level could be explained by defect in the antioxidant system with accumulation of lipid peroxides in the tumor as reported by Kumaraguruparan et al.(2002)]4[. Furthermore, Sener et al.(2007) found statistically significant decreased total antioxidant capacity with significantly increased serum MDA levels in EAC group compared to control group [42].
Urea and creatinine are metabolic products that are cleaned of the blood circulation by the kidneys to prevent their accumulation. Increasing serum levels of these substances is an indication of kidney function loss]43, 44.[ Data from this study suggest that mice groups implanted with EAC caused a loss of renal function compared with normal mice group and this is consistent with previous reports] 45, 46[. The urea and creatinine, biomarkers of renal function, were assessed in this study. It was observed in the current study that Nano-CE6 ameliorated the levels of serum urea and creatinine which is a marker of renal protection. This also indicates the protective role of Nano-CE6 against mice groups implanted with EAC which induced renal dysfunction.
The liver is implicated in the biotransformation of drugs and toxicants. The serum level of bilirubin and activities of the ALT, AST, ALP, and GGT liver enzymes, are considered reliable indices of hepatotoxicity]47, 48[. Hepatocellular injury give rise to increase in serum ALT and AST] 49.[ Bilirubin is associated with liver, intestines, and spleen while ALP and GGT are associated with the cell membrane] 50.[ Serum bilirubin and activities of ALP and GGT increased in hepatobiliary injury ]50[. The ALT, AST and GGT, biomarkers of hepatic function, were considered in this study. In this study, mice groups implanted with EAC caused increase in serum of ALT, AST and GGT activities. ALT and AST are present in the hepatocytes cytoplasm and mitochondria] 51.[ In this study, treatment with Nano-CE6 protected against increase in serum of ALT, AST, and GGT levels, which is an indication of hepato-protection by Nano-CE6. This also confirms the protective role of Nano-CE6 against hepato-dysfunction.
In the present work, study molecular study of fucosyltransferase-4 gene expression gene expression as a molecular diagnostic and prognostic markers for breast cancer revealed that there was a significantly negative correlation between modality of treatment and fucosyltransferase-4 gene expression in presence of Nano-CE6 in treated groups while a positive correlation between fucosyltransferase-4 gene expression and cancer progression in untreated cancerous group. Fucosyltransferase-4 gene expression significantly lower in mice groups treated with sonophoto therapy (in presence of Nano-CE6) than those treated with photo- or sono-therapy only (in presence of Nano-CE6 alone) followed by photo- or sono-therapy only (in absence of Nano-CE6 alone) while the highest expression was among untreated cancerous group. The present results further support that molecular detection of fucosyltransferase-4 gene expression using RT-PCR could be used as a diagnostic and prognostic predictor of breast cancer and was in agreement with other studies done by other authors [52-56].
Finally, it can be concluded that the present study opened new trends for cancer treatment therapy that needs to be further verified. The study gave profound results involving the use of sono-photo-dynamic modality employing exposure to infra-red laser and ultrasound with (pulsed and continuous) in combination with Nano-CE6 as a sono-photo sensitizer for treating Ehrlich tumor inoculated to mice as an experimental animal. The possible application of nano-carrier-sono-photo-dynamic therapy as in vivo anti-malignancy can open new line of research for modern cancer therapy that needs to be further investigated. Nanomaterial with their effective drug delivery great potential for can permit the feasibility of targeted therapy for disease treatment that needs further research for optimizing and maximizing benefits. Conjugated nanomaterial therapy can potentially provide a very valuable application for amplifying the benefits of photodynamic therapy. Response can be improved utilizing sonodynamic targeted therapy to treat deep or multiple lesions simultaneously. Further research is required to validate this novel therapy to prove feasibility and safety of application.
Conclusion
The present study gave profound results involving the use of sono-photo-dynamic modality employing exposure to infra-red laser and ultrasound with (pulsed and continuous) in combination with Nano-CE6 as a sono-photo sensitizer for treating implanted Ehrlich tumor in mice as an experimental animal showing promising results for cancer treatment.
Recommendation
The present study opened new trends for cancer treatment therapy that needs to be further verified. It is strictly recommended to conduct further experimental protocols aiming to safely apply this up-to-date modality on human and recording other biochemical and/or biophysical parameter’s variations.
Acknowledgements
Thanks to Medical Research Institute and Institute of Graduate Studies and Research laboratories co-workers.
Conflicts of interest
Authors declare that there is no conflict of interest.
Article Info
Article Type
Research ArticlePublication history
Received: Wed 03, Apr 2019Accepted: Wed 15, May 2019
Published: Wed 17, Jul 2019
Copyright
© 2023 Samir Ali . This is an open-access article distributed under the terms of the Creative Commons Attribution License, which permits unrestricted use, distribution, and reproduction in any medium, provided the original author and source are credited. Hosting by Science Repository.DOI: 10.31487/j.RDI.2019.03.04
Author Info
Corresponding Author
Samir AliLecturer, Department of Applied Medical Chemistry, Medical Research Institute, Alexandria University, Egypt
Figures & Tables


References
- Hanahan D, Weinberg RA (2000) The hallmarks of cancer. Cell 100: 57-70. [Crossref]
- Hanahan D, Weinberg RA (2011) Hallmarks of cancer: the next generation. Cell 144: 646-674. [Crossref]
- Sajib Chakraborty, Taibur Rahman (2012) The difficulties in cancer treatment. Ecancermediscience 6: ed16. [Crossref]
- Urruticoechea A, Alemany R, Balart J, Villanueva A, Viñals F et al. (2010) Recent advances in cancer therapy: an overview. Curr Pharm Des 16: 3-10. [Crossref]
- Macdonald IJ, Dougherty TJ (2001) Basic principles of photodynamic therapy. J Porphyrins Phthalocyan 5: 105-129.
- Ana P Castano, Tatiana N Demidova, Michael R Hamblin (2004) Mechanisms in photodynamic therapy: part one--photosensitizers, photochemistry and cellular localization. Photodiagnosis Photodyn Ther 1: 279-293. [Crossref]
- Mroz P, Yaroslavsky A, Kharkwal GB, Hamblin MR (2011) Cell death pathways in photodynamic therapy of cancer. Cancers (Basel) 3: 2516-2539. [Crossref]
- Brodin NP, Guha C, Tomé WA (2015) Photodynamic therapy and its role in combined modality anticancer treatment. Technol. Technol Cancer Res Treat 14: 355-368. [Crossref]
- Costley D, Mc Ewan C, Fowley C, McHale AP, Atchison J et al. (2015) Treating cancer with sonodynamic therapy: a review. Int J Hyperthermia 31: 107-117. [Crossref]
- Su X, Wang P, Yang S, Zhang K, Liu Q et al. (2015) Sonodynamic therapy induces the interplay between apoptosis and autophagy in K562 cells through ROS. Int J Biochem Cell Biol 60: 82-92. [Crossref]
- McEwan C, Owen J, Stride E, Fowley C, Nesbitt H et al. (2015) Oxygen carrying microbubbles for enhanced sonodynamic therapy of hypoxic tumours. J Control Release 203: 51-56. [Crossref]
- Wan GY, Liu Y, Chen BW, Liu YY, Wang YS et al. (2016) Recent advances of sonodynamic therapy in cancer treatment. Cancer Biol Med 13: 325-338. [Crossref]
- Miyoshi N, Kundu SK, Tuziuti T, Yasui K, Shimada I et al. (2016) Combination of Sonodynamic and Photodynamic Therapy against Cancer Would Be Effective through Using a Regulated Size of Nanoparticles. Nanosci Nanoeng 4: 1-11. [Crossref]
- Abd El-Kaream SA, Abd Elsamie GH, Abd-Alkareem AS (2018) Sono-photodynamic modality for cancer treatment using bio-degradable bio-conjugated sonnelux nanocomposite in tumor-bearing mice: Activated cancer therapy using light and ultrasound. Biochem Biophys Res Commun 503: 1075-1086. [Crossref]
- Rao CSS, Kumari DS (2012) Changes in plasma lipid peroxidation and the antioxidant system in women with breast cancer. Int J Basic Appl Sci 1: 429-438.
- Kumaraguruparan R, Subapriya R, Viswanathan P, Nagini S (2002) Tissue lipid peroxidation and antioxidant status in patients with adenocarcinoma of the breast. Clin Chim Acta 325: 165-170. [Crossref]
- Ziech D, Franco R, Georgakilas AG, Georgakila S, Malamou-Mitsi V et al. (2010) The role of reactive oxygen species and oxidative stress in environmental carcinogenesis and biomarker development. Chem Biol Interact 188: 334-349. [Crossref]
- Belal Naser, Cornelia Bodinet, Martin Tegtmeier, Ulrike Lindequist (2005) Thuja occidentalis (Arbor vitae): A Review of its Pharmaceutical, Pharmacological and Clinical Properties. Evid Based Complement Alternat Med 2: 69-78. [Crossref]
- LÓpez-Lázaro M (2008) Anticancer and carcinogenic properties of curcumin: Considerations for its clinical development as a cancer chemo preventive and chemotherapeutic agent. Mol Nut Food Res 52: 103-127. [Crossref]
- Cui-Li Zhang, Tao Zeng, Xiu-Lan Zhao, Li-Hua Yu, Zhen-Ping Zhu et al. (2012) Protective effects of garlic oil on hepatocarcinoma induced by Nnitrosodiethylamine in rats. Int J Biol Sci 8: 363-374. [Crossref]
- Chen B, Ning M, Yang G (2012) Effect of paeonol on antioxidant and immune regulatory activity in hepatocellular carcinoma rats. Molecules 17: 4672-4683. [Crossref]
- Vásquez-Garzón VR, Arellanes-Robledo J, García-Román R, Aparicio-Rautista DI, Villa-Treviño S (2009) Inhibition of reactive oxygen species and pre-neoplastic lesions by quercetin through an antioxidant defense mechanism. Free Radic Res 43: 128-137. [Crossref]
- Usunomena U, Ademuyiwa A, Tinuade O, Uduenevwo F, Martin O et al. (2012) N-nitrosodimethylamine (NDMA), liver function enzymes, renal function parameters and oxidative stress parameters: A Review. Br J Pharmaco Toxicol 3: 165-176.
- Rao G, Rao CV, Pushpangadan P, Shirwaikar A (2006) Hepatoprotective effects of rubiadin, a major constituent of Rubiacordifolia Linn. J Ethnopharmacol 103: 484-490. [Crossref]
- Revathi R, Manju V (2013) The effects of Umbelliferone on lipid peroxidation and antioxidant status in diethylnitrosamine induced hepatocellular carcinoma. J Acute Medicine 3: 73-82.
- Wu G, Fang YZ, Yang S, Lupton JR, Turner ND (2004) Glutathione metabolism and its implications for health. J Nutr 134: 489-492. [Crossref]
- Blair IA (2006) Endogenous glutathione adducts. Curr Drug Metab 7: 853-872. [Crossref]
- Ghosh D, Choudhury ST, Ghosh S, Mandal AK, Sarkar S et al. (2012) Nanocapsulated curcumin: Oral chemopreventive formulation against diethylnitrosamine induced hepatocellular carcinoma in rat. Chem Biol Interact 195: 206-214. [Crossref]
- Rajeshkumar NV, Kuttan R (2000) Inhibition of N-nitrosodiethylamine induced hepatocarcinogenesis by Picroliv. J Exp Clin Cancer Res 19: 459-465. [Crossref]
- Pradeep K, Mohen CV, Gobian K, Karthikeyan S (2007) Silymarin modulates the oxidant-antioxidant imbalance during diethylnitrosamine induced oxidative stress in rats. Eur J Pharmacol 560: 110-116. [Crossref]
- Ren W, Qiao Z, Wang H, Zhu L, Zhang L (2003) Flavonoids: promising anticancer agents. Med Res Rev 23: 519-534. [Crossref]
- Bemis D, Capodice J, Gorroochurn P, Katz AE, Buttyan R (2006) Anti-prostate cancer activity of a s-carboline alkaloid enriched extract from Rauwolfiavomitoria. Int J Oncol 29: 1065-1073. [Crossref]
- Grippo AA, Capps K, Rougeau B, Gurley BJ (2007) Analysis of flavonoid phytoestrogens in botanical and ephedra-containing dietary supplements. Ann Pharmacother 41: 1375-1382. [Crossref]
- Jiang J, Hu C (2009) Evodiamine: a novel anti-cancer alkaloid from Evodiarutaecarpa. Molecules 14: 1852-1859. [Crossref]
- Kabashima H, Miura N, Shimizu M, Shinoda W, Wang X et al. (2010) Preventive impact of alkaloids with anti-cancer effect extracted from natural herb and the derivatives. Webmed Central 1: 1-19.
- Thoppil R, Bishayee A (2011) Terpenoids as potential chemopreventive and therapeutic agents in liver cancer. World J Hepatol 3: 228-249. [Crossref]
- Kuno T, Tsukamoto T, Hara A, Tanaka T (2012) Cancer chemoprevention through the induction of apoptosis by natural compounds. J Biophys Chem 3: 156-173.
- Haghiac M, Walle T (2005) Quercetin induces necrosis and apoptosis in SCC-9 oral cancer cells. Nutr Cancer 53: 220-231. [Crossref]
- Vidya Priyadarsini R, Senthil Murugan R, Maitreyi S, Ramalingam K, Karunagaran D et al. (2010) The flavonoid quercetin induces cell cycle arrest and mitochondria-mediated apoptosis in human cervical cancer (HeLa) cells through p53 induction and NF-kB inhibition. Eur J Pharmacol 649: 84-91. [Crossref]
- Bishayee K, Ghosh S, Mukherjee A, Sadhukhan R, Mondal JK et al. (2013) Quercetin induces cytochrome-c release and ROS accumulation to promote apoptosis and arrest the cell cycle in G2/ M, in cervical carcinoma: signal cascade and drug–DNA interaction. Cell Prolif 46: 153-163. [Crossref]
- Kumaraguruparan R, Subapriya R, Kabalimoorthy J, Nagini S (2002) Antioxidant profile in the circulation of patients with fibroadenoma and adenocarcinoma of the breast. Clin Biochem 35: 275-279. [Crossref]
- Sener DE, Gönenç A, Akinci M, Torun M (2007) Lipid peroxidation and total antioxidant status in patients with breast cancer. Cell Biochem Funct 25: 377-382. [Crossref]
- Han W, Bonventre J (2004) Biologic markers for the early detection of acute kidney injury. Curr Opin Crit Care 10: 476-482. [Crossref]
- George G, Wakasi M, Egoro E (2014) Creatinine and urea levels as critical markers in end-stage renal failure. Research and Review. J Med Heal Sci 3: 41-44.
- Paliwal R, Sharma V, Pracheta, Sharma S, Yadav S et al. (2011) Antinephrotoxic effect of administration of Moringaoleifera Lam. in amelioration of DMBA-induced renal carcinogenesis in Swiss albino mice. Biol Med 3: 27-35.
- Sharma V, Paliwal R, Janmeda P, Sharma SH (2012) The reno-protective efficacy of Moringaoleifera pods on xenobiotic enzymes and antioxidant status against 7,12-dimethylbenz[a]anthracene exposed mice. J Chin Integr Med 10: 1171-1178.
- Boone L, Meyer D, Cusick P, Ennulat D, Bolliger AP et al. (2005) Selection and interpretation of clinical pathology indicators of hepatic injury in preclinical studies. Vet Clin Pathol 34: 182-188. [Crossref]
- Singh A, Bhat TK, Sharma OM (2011) Clinical biochemistry of hepatotoxicity. J Clinic Toxicol 4: 1-19.
- Ozer J, Ratner M, Shaw M, Bailey W, Schomaker S (2008) The current state of serumbiomarkers of hepatotoxicity. Toxicology 245: 194-205. [Crossref]
- Ramaiah SK (2007) A toxicologist guide to the diagnostic interpretation of hepatic biochemical parameters. Food Chem Toxicol 45: 1551-1557. [Crossref]
- Amacher DE (2002) A toxicologist's guide to biomarkers of hepatic response. Hum Exp Toxicol 21: 253-262. [Crossref]
- Kennedy SM, O’Driscoll L, Purcell R, Fitz-simons N, McDermott EW et al. (2003) Prognostic importance of Fucosyltransferase 4 in breast cancer. Br J Cancer 88: 1077-1083.
- O'Driscoll L, Cronin D, Kennedy SM, Purcell R, Linehan R et al. (2003) Lack of prognostic significance of Fucosyltransferase 4, Fucosyltransferase 4-DEx3, Fucosyltransferase 4-2B, galectin-3, bag-1, bax-a and MRP-1 mRNAs in breast cancer. Cancer Lett 201: 225-236.
- Ryan BM, Konecny GE, Kahlert S, Wang HJ, Untch M et al. (2006) Fucosyltransferase 4 expression in breast cancer predicts clinical outcome and is associated with HER2, VEGF, urokinase plasminogen activator and PAI-1. Ann Oncol 17: 597-604.
- Yang X, Zhang Z, Jia S, Liu Y, Wang X et al. (2007) Overexpression of fucosyltransferase IV in A431 cell line increases cell proliferation. Int J Biochem Cell Biol 39: 1722-1730. [Crossref]
- Jha K, Kumar M, Shukla VK, Pandey M (2012) Fucosyltransferase 4 Expression and Correlation with Clinico-pathological Parameters in Breast Cancer. World J Pathol 39: 1722-1730. [Crossref]