Stability Indicating HPLC Method for the Simultaneous Estimation of Triamcinolone Acetonide and Benzyl Alcohol in Pure Form and Epirelefan® Vial
A B S T R A C T
A rapid, sensitive, and accurate stability indicating HPLC method was developed for the simultaneous determination of triamcinolone acetonide and benzyl alcohol in pure form, degradation products and pharmaceutical preparation. The separation was carried out on RP BDS Hypersil® C18 column (150 x 4.60 mm, 5μm) using an isocratic mobile phase composed of acetonitrile: 0.05 M phosphate buffer PH 3.50 (55 : 45). Both benzyl alcohol and triamcinolone acetonide quickly eluted at 1.67 min and 3.42 min, respectively, with a flow rate of 1.50 mL /min and UV detection at 254 nm. The linearity was in the range of 1 – 50 µg/mL for triamcinolone acetonide and 2 - 10 µg/mL for benzyl alcohol. The method has been validated for linearity, accuracy, precision, specificity, limit of detection, limit of quantification, robustness, and ruggedness as per the ICH guidelines. Finally, the method was compared statistically with reference methods indicating that there is no significant difference between them in respect of precision and accuracy.
Keywords
Stability indicating, HPLC, triamcinolone acetonide, benzyl alcohol, ICH guidelines
Introduction
Triamcinolone is chemically (1S,2S,4R,8S,9S,11S,12R,13S)-12-fluoro-11-hydroxy-8-(2 hydroxyacetyl)-6,6,9,13-tetramethyl-5,7-dioxapentacyclo[10.8.0.02,9.04,8.013,18]icosa-14,17-dien-16-one (Figure 1). Triamcinolone acetonide (TAM) is the acetonide salt form of triamcinolone, a synthetic glucocorticoid with an immunosuppressive and anti-inflammatory activity [1] (Link1). TAM binds to specific cytosolic glucocorticoid receptors and subsequently interacts with glucocorticoid receptor response element on DNA and alters gene expression [2]. This results in an induction of the synthesis of certain anti-inflammatory proteins while inhibiting the synthesis of certain inflammatory mediators [3]. Consequently, an overall reduction in chronic inflammation and autoimmune reactions are accomplished [4]. Few chromatographic methods have been reported also for determination of TAM either alone or in combination with other drugs in different matrices [5-11].
On the other hand, benzyl alcohol (BZA) is chemically named as phenyl methanol (Figure 1) and it is an aqueous soluble preservative widely used in injectable pharmaceutical preparations as well as in cosmetic products [12]. Although toxic in neonates and infants, it is generally recognized as safe by the FDA at concentrations up to 5% in adults [13]. The effect of BZA present as preservative in bacteriostatic normal saline has recently come under investigation when administered via intra-articular injection. Patients who undergo MRI-based arthrography for standard clinical indications are commonly administered a contrast agent like gadolinium diluted in bacteriostatic saline (Link2) [14]. Few chromatographic methods have been reported also for determination of BZA in combination with other drugs [15-18].

Figure 1: Chemical structures of triamcinolone acetonide (TAM) and benzyl alcohol (BZA).
To the best of our knowledge, this is the first paper dealing with stability indicating chromatographic separation of TAM and BZA despite they are formulated in a vial form. As such, the present work introduces a simple, rapid, reproducible, and sensitive HPLC method that has been established and validated for the determination of TAM & BZA mixture in their pure forms, degradation products and in their tablet dosage form according to International Conference on Harmonization (ICH) guidelines [19].
Experimental
I Materials and Reagents
TAM and BZA were kindly supplied by EIPICO Pharmaceuticals Company, EGYPT. Epirelefan® vial (EIPICO) was labeled to contain 40 mg/mL TAM suspension in BZA. The used chemicals in all experiments were of analytical HPLC grade, methanol and acetonitrile (Lab Scan, Gliwice, PL), potassium dihydrogen phosphate (Fluka, Loughborough, UK), and orthophosphoric acid 85% (Merck, USA) were used. Distilled water was obtained through Millipore filter 0.45 µm throughout the whole experiment. A combination of acetonitrile : 0.05 M potassium hydrogen phosphate buffer pH 3.50 (55 : 45) was mixed and degaussed in a fast clean ultra sonicator for 5 minutes. Finally, the mixture was filtered through 0.45μm membrane filter. 0.1 N HCL, 0.1 N NaOH, and 0.35% H2O2 were used for stability studies.
II Instrumentation and Chromatographic Conditions
WATERS® 2695 SEPARATION MODULE EIPICO Code: 0302QCI0112, equipped with Quaternary pump, Auto sampler, Variable wavelength detector and Column thermostat are operated by waters Empower 2 software. The pH of the mobile phase was adjusted using a Metrohm 744 pH meter (Herisau, Switzerland). RP-HPLC separation of TAM and BZA was achieved using RP BDS hypersil® C18 column (150 x 4.60 mm, 5μm) (phenomenex, USA). The elution was isocratic and the mobile phase composed of 55% acetonitrile and 45% phosphate buffer (0.05 M potassium dihydrogen phosphate, adjusted to pH 3.50 by using orthophosphoric acid). The injection volume was 20 µL, and the temperature of column was kept at 40°C. Flow rate was adjusted at 1.50 mL/min and detection was achieved at 254 nm (Table 1). Prior to use, the mobile phase was degassed and filtered by passing through a 0.2 µm pore size membrane filter (Millipore, Milford, MA, USA).
Table 1: Chromatographic conditions for the proposed method.
|
Parameters |
Conditions |
|
Column |
RP BDS Hypersil® C18 (150 x 4.60 mm, 5μm) (phenomenex, USA) |
|
Mobile phase |
Acetonitrile : 0.05 M phosphate buffer pH 3.50 (55 : 45) |
|
UV detection, nm |
254 |
|
Flow rate, mL/min |
1.50 |
|
Injected volume, µl |
20 |
|
Temperature |
40 |
III Preparation of Standard Solutions
An accurately weighed 10 mg of TAM standard and 10 mg of BZA standard were transferred to a 100 mL volumetric flask, dissolved and completed to volume with methanol.
IV Construction of Calibration Curves
Aliquots of standard solution of TAM and BZA were taken and adjusted with methanol to obtain their final concentration in the range of 1-50 µg/mL for TAM and 2- 10 µg/mL for BZA. Calibration curves were constructed by plotting area under curve against the concentration.
V Forced Degradation Samples Preparation
i Acid Degradation
5 mL of the stock standard solution was transferred into 100 mL volumetric flask, then 10 mL of 0.1 N HCL was added and placed in a boiling water bath for about 3 minutes. The solution was cooled for 5 minutes, neutralized by addition of 0.01 N NaOH to pH 7 and completed to 100 mL with methanol.
ii Alkaline Degradation
5 mL of the stock standard solution was transferred into 100 mL volumetric flask, then 10 mL of 0.1 N NaOH was added and placed in a boiling water bath for about 3 minutes. The solution was cooled for 5 minutes, neutralized by addition of 0.01 N HCL to pH 7 and completed to 100 mL with methanol.
iii Oxidative Degradation
5 mL of the stock standard solution was transferred into 100 mL volumetric flask, then 5 mL diluted H2O2 (5mL of 35% H2O2 in 100 mL H2O) was added and completed to 100 mL with methanol.
iv Heat Degradation
5 mL of the stock standard solution was transferred into 100 mL volumetric flask, then 10 mL of distilled water was added and placed in a boiling water bath for about 3 minutes. The solution was cooled for 5 minutes and completed to 100 mL with methanol.
VI Preparation and Analysis of Pharmaceutical Preparations
2 ml of the well shaken Epirelefan® vial suspension (40 mg/mL TAM, 1 mg/mL BZA) was transferred into 100 mL volumetric flask, then the volume was completed to the mark with methanol. Working solutions were then prepared as in the above procedure and completed as previously mentioned under the general procedure.
Results and Discussion
I Optimization of the Chromatographic Conditions
This method was optimized after studying many variables. Many columns were used to obtain the optimum separation and shortest run time. RP BDS hypersil® C18 column (150 x 4.60 mm, 5μm) (phenomenex, USA) was used. In order to obtain sharp, separated peaks without tailing or distortion, further optimization was needed. As such, different wavelengths and percentages of mobile phase contents were used. Mobile phase composed of acetonitrile and 0.05 M phosphate buffer PH 3.50 (55 : 45) respectively gave the best results with wavelength at 254 nm. Under these conditions, BZA and TAM in pure form can be separated and eluted at 1.67 and 3.42 min, respectively, as illustrated in (Figure 2A).
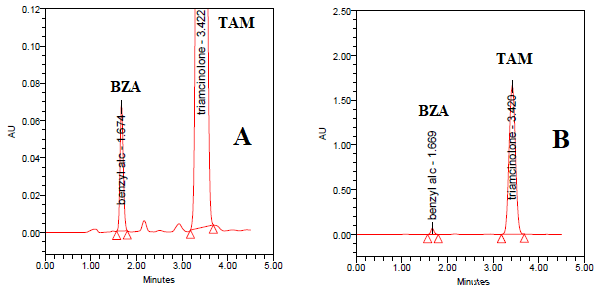
Figure 2: HPLC chromatogram of mixture of triamcinolone acetonide (TAM) and benzyl alcohol (BZA) in A) pure form and B) their tablets using RP BDS Hypersil® C18 (150 x 4.60 mm, 5μm) and a mobile phase of acetonitrile : 0.05 M phosphate buffer pH 3.50 (55 : 45, v/v). Other chromatographic conditions are stated in (Table 1).
II Method Validation
Method Validation of the developed method was carried out according to ICH guidelines for its linearity, accuracy, precision, specificity, robustness, ruggedness, limit of detection and limit of quantification [19].
i System Suitability Parameters
The column efficiency, resolution, and peak symmetry were calculated for the standard solutions (n=6). The values obtained demonstrated the suitability of the system for the analysis of this drug combination (Table 2). The optimum mobile phase showed symmetrical peaks (1.03 < T < 1.14), capacity factor (1< k < 10), resolution > 2 and theoretical plates> 2000 as per required by the center for drug evaluation and research [20].
Table 2: System suitability parameters for triamcinolone acetonide (TAM) and benzyl alcohol (BZA) in their pure form.
|
Parameters |
BZA |
TAM |
Reference values [20] |
|
Retention time, tr |
1.67 |
3.42 |
|
|
Capacity factor, k' |
1.09 |
3.27 |
Accepted k' value (1-10) |
|
Peak asymmetry (Tailing factor, T) |
1.14 |
1.03 |
Accepted T value ≤ 2 |
|
Therotical plates, N |
2726 |
2869 |
Accepted N value > 2000 |
|
Resolution, Rs |
------ |
7.61 |
Accepted value > 2 |
|
Selectivity (Separation factor, α) |
------ |
3.00 |
|
ii Linearity
Linearity of this method was studied by preparing five different concentrations of the standard solutions of TAM and BZA. Area under peak of these solutions were collected and the calibration curves were obtained by plotting absorbance vs. concentration of the drugs showing linearity in the concentration range of 1-50 µg/mL for TAM and 2-10 µg/mL for BZA (Table 3). Linear regression equations were found to be y = 8.545x + 0.3018, and y = 1615420x + 1269, while the regression coefficient values (r) were 1 and 0.9999 for TAM and BZA, respectively, indicating a high degree of linearity.
Table 3: Results of analysis for triamcinolone acetonide (TAM) and benzyl alcohol (BZA) in pure form using the proposed method.
|
|
|
TAM |
|
|
|
BZA |
|
|
|
|
Taken µg/mL |
Found µg/mL |
Recovery % |
Taken µg /mL |
|
Found µg /mL |
Recovery % |
|
|
|
1 |
0.99 |
99.09 |
2 |
|
1.99 |
99.73 |
|
|
|
5 |
|
4.98 |
99.53 |
4 |
|
4.03 |
100.63 |
|
|
10 |
|
10.05 |
100.53 |
6 |
|
6.01 |
100.08 |
|
|
20 |
|
19.98 |
99.91 |
8 |
|
7.94 |
99.19 |
|
|
50 |
|
49.84 |
99.67 |
10 |
|
10.04 |
100.40 |
|
Mean |
|
|
|
99.75 |
|
|
|
100.01 |
|
±SD |
|
|
|
0.53 |
|
|
|
0.02 |
|
±RSD |
|
|
|
0.53 |
|
|
|
0.02 |
|
±SE |
|
|
|
0.24 |
|
|
|
0.019 |
|
Variance |
|
|
|
0.28 |
|
|
|
0.32 |
|
LOD (µg/mL) |
|
|
|
0.19 |
|
|
|
0.15 |
|
LOQ (µg/mL) |
|
|
|
0.62 |
|
|
|
0.46 |
iii Accuracy
Accuracy was determined by using concentrations in the calibrations range from the vial sample. These concentrations represent the lower part of calibration curve (5 µg/mL of TAM and 4 µg/mL of BZA), the middle part (10 & 20 µg/mL of TAM and 6 & 8 µg/mL of BZA), and the higher concentration part (50 µg/mL of TAM and 10 µg/mL of BZA). Mean recoveries were reported to be 99.83 and 100.85 while RSD were calculated to be 0.51 and 0.87 for TAM and BZA, respectively, indicating a high degree of the method accuracy (Table 4).
Table 4: Results of accuracy study (recovery).
|
Sample No. |
|
TAM |
|
|
BZA |
|
|
Nominal conc. (µg/mL) |
Found conc. (µg/mL) |
Recovery % |
Nominal conc. (µg/mL) |
Found conc. (µg/mL) |
Recovery % |
|
|
1 |
5 |
4.96 |
99.30 |
4 |
4.04 |
101.13 |
|
2 |
10 |
10.05 |
100.49 |
6 |
6.03 |
100.57 |
|
3 |
20 |
19.98 |
99.88 |
8 |
8.15 |
101.89 |
|
4 |
50 |
49.83 |
99.6528 |
10 |
9.98 |
99.81 |
|
Mean |
|
|
99.83 |
|
|
100.85 |
|
SD |
|
|
0.50 |
|
|
0.88 |
|
RSD |
|
|
0.51 |
|
|
0.87 |
iv Precision
Precision was calculated in terms of method precision and intermediate precision. Method precision (% repeatability) of the proposed HPLC method was determined by 6 replicate injections of different homogenous samples of TAM and BZA in the same day, while intermediate precision (day to day precision) was determined by 3 replicate injections of TAM and BZA per day table. However, the % recovery was within the acceptable range of 98 to 102 % and RSD of these injections does not exceed 2% as reported in (Table 5), indicating that the developed method is highly precise and reproducible.
Table 5: Results of intra-day and inter-day precision of triamcinolone acetonide (TAM) and benzyl alcohol (BZA).
|
Drug |
conc. µg /mL |
Intra-day |
Inter-day |
||
|
Mean ± SD |
RSD |
Mean ± SD |
RSD |
||
|
TAM |
10 |
100.95 ± 0.083 |
0.0824 |
101.02 ± 0.078 |
0.077 |
|
BZA |
4 |
101.44 ± 0.17 |
0.17 |
101.86 ± 0.12 |
0.12 |
v Limit of Detection and Limit of Quantification
The limit of detection (LOD) was calculated from the linearity curve using the formula LOD = 3.3 × SD/Slope while the limit of Quantification (LOQ) was calculated from the linearity curve using the formula LOQ = 10 × SD/Slope. The LOD for TAM was confirmed to be 0.19 µg/mL and that for BZA was 0.15 µg/mL. On the other hand, The LOQ for TAM was calculated to be 0.62 µg/mL and 0.46 µg/mL for BZA (Table 3). These results indeed show that the proposed method is highly sensitive and applicable for pharmaceutical studies even if detection of small concentrations in the nanogram range is required.
vi Specificity
The specificity of the analytical method was checked in whereas, the chromatograms of the vial or the degradation products under different drastic conditions illustrate that there is no interference of the peaks of excipients or the degradation products in the determination of TAM and BZA as seen in (Figures 2B & 3).

Figure 3: HPLC chromatogram of mixture of triamcinolone acetonide (TAM) and benzyl alcohol (BZA) in presence of A) acid degradation products, B) alkaline degradation products, C) heat degradation products, and D) H2O2 degradation products using RP BDS Hypersil® C18 (150 x 4.60 mm, 5μm) and a mobile phase of acetonitrile : 0.05 M phosphate buffer pH 3.50 (55 : 45, v/v). Other chromatographic conditions are stated in (Table 1).
vii Ruggedness and Robustness
Ruggedness of the method was determined by carrying out the experiment on by different operators using the same chromatographic conditions. Robustness of the method was determined by subjecting the method to slight changes in the chromatographic conditions. No significant changes in the chromatograms were observed, where all SD values were less than 2 (Table 6), proving that the developed method is highly rugged and robust.
Table 6: Results of robustness.
|
Drug |
TAM |
BZA |
|
|
Mean ± SD |
Mean ± SD |
|
Flow rate 1.50 |
99.90 ± 0.08 |
101.44 ± 0.17 |
|
Flow rate 1.55 |
101.86 ± 0.12 |
99.65 ± 0.10 |
|
Mobile phase 55:45 |
99.90 ± 0.08 |
101.44 ± 0.17 |
|
Mobile phase 54:46 |
105.31 ± 0.57 |
106.45 ± 1.00 |
viii Analysis of Vial
EPIREFELAN® vial which contains 40 mg/mL TAM and 1 mg/mL BZA has been successfully analysed by the proposed RP-HPLC method. Excipients and impurities did not show interference indicating high specificity of the method. Results obtained were compared to those obtained by applying reference methods where Student’s t-test and F-test were performed for comparison [5, 15]. Results shown in (Table 7) indicated that calculated t and F values were less than tabulated ones for TAM and BZA which in turn indicate that there is no significant difference between proposed method and reference ones relative to precision and accuracy.
Table 7: Statistical analysis of results obtained by the proposed HPLC method applied on pharmaceutical formulation compared with reference methods.
|
DRUG |
Recovery ± SD |
Reference method number |
Student t- values |
F- Values |
|||
|
Proposed Method |
N |
Reference Method |
N |
||||
|
TAM |
100.70 ± 0.14 |
4 |
100.60 ± 0.32 |
4 |
[5] |
0.08 )1.94)a |
5.22 (9.28)b |
|
BZA |
100.90 ± 0.44 |
4 |
99.18 ± 0.75 |
4 |
[15] |
1.92 )1.94)a |
2.92 (9.28)b |
a and b are the Theoretical Student t-values and F-ratios at p=0.05.
Conclusion
In this study, an accurate, rapid, simple and sensitive RP-HPLC method with UV detection was developed for the assay of triamcinolone acetonide and benzyl alcohol in pure form, in presence of degradation products under different drastic conditions and in vial form. The complete separation of the analytes was achieved within short chromatographic run time (4 min) with no interfering peaks where there is no need for traditional HPLC methods with complex mobile phase mixtures, long chromatographic run times and more solvent consumed methods. The method was compared statistically with reference methods indicating that there is no significant difference between them in respect of precision and accuracy.
Conflicts of Interest
None.
Ethical Approval
This manuscript does not include any studies on human or animals.
Article Info
Article Type
Research ArticlePublication history
Received: Mon 09, Nov 2020Accepted: Sat 16, Jan 2021
Published: Sat 23, Jan 2021
Copyright
© 2023 Mahmoud M. Sebaiy. This is an open-access article distributed under the terms of the Creative Commons Attribution License, which permits unrestricted use, distribution, and reproduction in any medium, provided the original author and source are credited. Hosting by Science Repository.DOI: 10.31487/j.AJMC.2020.01.11
Figures & Tables
Table 1: Chromatographic conditions for the proposed method.
|
Parameters |
Conditions |
|
Column |
RP BDS Hypersil® C18 (150 x 4.60 mm, 5μm) (phenomenex, USA) |
|
Mobile phase |
Acetonitrile : 0.05 M phosphate buffer pH 3.50 (55 : 45) |
|
UV detection, nm |
254 |
|
Flow rate, mL/min |
1.50 |
|
Injected volume, µl |
20 |
|
Temperature |
40 |
Table 2: System suitability parameters for triamcinolone acetonide (TAM) and benzyl alcohol (BZA) in their pure form.
|
Parameters |
BZA |
TAM |
Reference values [20] |
|
Retention time, tr |
1.67 |
3.42 |
|
|
Capacity factor, k' |
1.09 |
3.27 |
Accepted k' value (1-10) |
|
Peak asymmetry (Tailing factor, T) |
1.14 |
1.03 |
Accepted T value ≤ 2 |
|
Therotical plates, N |
2726 |
2869 |
Accepted N value > 2000 |
|
Resolution, Rs |
------ |
7.61 |
Accepted value > 2 |
|
Selectivity (Separation factor, α) |
------ |
3.00 |
|
Table 3: Results of analysis for triamcinolone acetonide (TAM) and benzyl alcohol (BZA) in pure form using the proposed method.
|
|
|
TAM |
|
|
|
BZA |
|
|
|
|
Taken µg/mL |
Found µg/mL |
Recovery % |
Taken µg /mL |
|
Found µg /mL |
Recovery % |
|
|
|
1 |
0.99 |
99.09 |
2 |
|
1.99 |
99.73 |
|
|
|
5 |
|
4.98 |
99.53 |
4 |
|
4.03 |
100.63 |
|
|
10 |
|
10.05 |
100.53 |
6 |
|
6.01 |
100.08 |
|
|
20 |
|
19.98 |
99.91 |
8 |
|
7.94 |
99.19 |
|
|
50 |
|
49.84 |
99.67 |
10 |
|
10.04 |
100.40 |
|
Mean |
|
|
|
99.75 |
|
|
|
100.01 |
|
±SD |
|
|
|
0.53 |
|
|
|
0.02 |
|
±RSD |
|
|
|
0.53 |
|
|
|
0.02 |
|
±SE |
|
|
|
0.24 |
|
|
|
0.019 |
|
Variance |
|
|
|
0.28 |
|
|
|
0.32 |
|
LOD (µg/mL) |
|
|
|
0.19 |
|
|
|
0.15 |
|
LOQ (µg/mL) |
|
|
|
0.62 |
|
|
|
0.46 |
Table 4: Results of accuracy study (recovery).
|
Sample No. |
|
TAM |
|
|
BZA |
|
|
Nominal conc. (µg/mL) |
Found conc. (µg/mL) |
Recovery % |
Nominal conc. (µg/mL) |
Found conc. (µg/mL) |
Recovery % |
|
|
1 |
5 |
4.96 |
99.30 |
4 |
4.04 |
101.13 |
|
2 |
10 |
10.05 |
100.49 |
6 |
6.03 |
100.57 |
|
3 |
20 |
19.98 |
99.88 |
8 |
8.15 |
101.89 |
|
4 |
50 |
49.83 |
99.6528 |
10 |
9.98 |
99.81 |
|
Mean |
|
|
99.83 |
|
|
100.85 |
|
SD |
|
|
0.50 |
|
|
0.88 |
|
RSD |
|
|
0.51 |
|
|
0.87 |
Table 5: Results of intra-day and inter-day precision of triamcinolone acetonide (TAM) and benzyl alcohol (BZA).
|
Drug |
conc. µg /mL |
Intra-day |
Inter-day |
||
|
Mean ± SD |
RSD |
Mean ± SD |
RSD |
||
|
TAM |
10 |
100.95 ± 0.083 |
0.0824 |
101.02 ± 0.078 |
0.077 |
|
BZA |
4 |
101.44 ± 0.17 |
0.17 |
101.86 ± 0.12 |
0.12 |
Table 6: Results of robustness.
|
Drug |
TAM |
BZA |
|
|
Mean ± SD |
Mean ± SD |
|
Flow rate 1.50 |
99.90 ± 0.08 |
101.44 ± 0.17 |
|
Flow rate 1.55 |
101.86 ± 0.12 |
99.65 ± 0.10 |
|
Mobile phase 55:45 |
99.90 ± 0.08 |
101.44 ± 0.17 |
|
Mobile phase 54:46 |
105.31 ± 0.57 |
106.45 ± 1.00 |
Table 7: Statistical analysis of results obtained by the proposed HPLC method applied on pharmaceutical formulation compared with reference methods.
|
DRUG |
Recovery ± SD |
Reference method number |
Student t- values |
F- Values |
|||
|
Proposed Method |
N |
Reference Method |
N |
||||
|
TAM |
100.70 ± 0.14 |
4 |
100.60 ± 0.32 |
4 |
[5] |
0.08 )1.94)a |
5.22 (9.28)b |
|
BZA |
100.90 ± 0.44 |
4 |
99.18 ± 0.75 |
4 |
[15] |
1.92 )1.94)a |
2.92 (9.28)b |
a and b are the Theoretical Student t-values and F-ratios at p=0.05.
References
- Aschenbrenner DS, Venable SJ (2009) Drug Therapy in Nursing Hardcover Book. 681-682.
- Juni P, Hari R, Rutjes AW, Fischer R, Silletta MG et al. (2015) Intra-articular corticosteroid for knee osteoarthritis. Cochrane Database Syst Rev 10: CD005328. [Crossref]
- Rozental TD, Sculco TP (2000) Intra-articular corticosteroids: An updated review. Am J Orthop (Belle Mead NJ) 29: 18-23. [Crossref]
- Scherer J, Rainsford KD, Kean CA, Kean WF (2014) Pharmacology of intra-articular triamcinolone. Inflammopharmacol 22: 201-217. [Crossref]
- Erika RMK, Elisabeth ASG, Maria Iněs RMS (1997) Determination of Triamcinolone Acetonide in Ointment by UV Derivative Spectrophotometry and High Performance Liquid Chromatography. Anal Lett 30: 1861-1871.
- Tölgyesi A, Verebey Z, Sharma VK, Kovacsics L, Fekete J (2010) Simultaneous determination of corticosteroids, androgens, and progesterone in river water by liquid chromatography-tandem mass spectrometry. Chemosphere 78: 972-979. [Crossref]
- LL Smith, T Foell, R Demaio, M Halwer (1959) 16α‐Hydroxy steroids II. Partition chromatography of triamcinolone and related steroids J Am Pharm Assoc Am Pharm Assoc 48: 528-532. [Crossref]
- Asmaa AE, Ehab FE, Amaal AA (2019) RP-HPLC-UV Detection Method for the Simultaneous Determinat ion of Econazole Nitrate, Triamcinolone Acetonide and Benzoic Acid in Ternary Mixture. Current Pharm Anal 15.
- Döppenschmitt SA, Scheidel B, Harrison F, Surmann JP (1996) Simultaneous determination of triamcinolone acetonide and hydrocortisone in human plasma by high-performance liquid chromatography. J Chromatogr B Biomed App 682: 79-88. [Crossref]
- Haneef J, Shaharyar M, Husain A, Rashid M, Mishra R et al. (2013) Application of LC–MS/MS for quantitative analysis of glucocorticoids and stimulants in biological fluids. J Pharm Anal 3: 341-348. [Crossref]
- Oliva A, Monzón C, Santoveña A, Fariña JB, Llabrés M (2016) Development of an ultra high performance liquid chromatography method for determining triamcinolone acetonide in hydrogels using the design of experiments/design space strategy in combination with process capability index. J Sep Sci 39: 2689-2701. [Crossref]
- EL sherbiny D, Wahba MEK (2019) Development and validation of liquid chromatographic methods for the estimation of the acceptance values of some hazardous preservatives in pharmaceutical formulations. A comparative study. J Taibah Univ Sci 14: 294-304.
- Sidhatha DR, Jousha PG, Mary EK (2015) Chapter 47-Miscellaneous Drugs, Materials, Medical Devices and Techniques. Side Effects of Drugs Annual 37: 603.
- Mark K, Kelly DK, Kent EV (2012) Elsevier's Integrated Review Pharmacology Book (Second Edition). Elsevier 41-78.
- Khalid MK, Abdul Rafiq K, Shahnaz P, Zia U, Nida A et al. (2008) High-Performance Liquid Chromatographic Quantitative Determination of Amcinonide and Benzyl Alcohol in Pharmaceutical Preparations. The Open Anal Chem J 2: 74-77.
- Floor BJ, Klein AE, Muhammad N, Ross D (1985) Stability‐indicating liquid chromatographic determination of etoposide and benzyl alcohol in injectable formulations. J Pharm Sci 74: 197-200. [Crossref]
- George CW, Meera RI, Arthur MG, Albert MF, Bhogi BS (1998) A High Pressure Liquid Chromatography Assay Method for Analysis of Deslorelin and Benzyl Alcohol in Deslorelin Injection. J Liq Chromatogr Rel Tech 21: 2183-2190.
- Mostafa MB, Dina SE, Magdi MA, Tarek SB (2020) A Highly Selective Stability-Indicating HPLC Method for Simultaneous Estimation of Sertaconazole with Two Coformulated Preservatives in Pharmaceutical Dosage Forms. Chromatographia 83: 191-203.
- Guidance for industry (1996) Q2B validation of analytical procedures:Methodology. Inte Confer Harmoniz (ICH).
- CDER center for drug evaluation and research (1994) Reviewer guidance; Validation of chromatographic methods.