T-Cell Receptor Clustering Methods Used for Single Cell Analysis: Potential Application in Oncology
A B S T R A C T
We know that T-cell activation and effector function is integral for cancer cell destruction in immunotherapeutic treatment in oncology. The fundamental behaviour of T-cells at the time of activation is poorly understood but is likely to be central to this action. Cellular clustering occurs on at least two levels: gathering of multiple mobile cells of similar type, and aggregation between different cell types. Receptors are implicated in both of these processes. Analysis of receptor clustering is a different process whereby receptors form clusters on the cell membrane surface and can be studied to determine their relationship to immune activation. Receptor clustering has been shown to occur in some (perhaps all) cell types, but little is known about this phenomenon, particularly in T-lymphocytes. T-Cell Receptors (TCRs) which are important for the activation of T-lymphocytes. T-cell receptors, also known as cluster of differentiation 3 (CD3) molecules, bind specific antigen to create intracellular signaling in the process of T-cell activation as part of the immune response. The detail of how TCRs physically behave on the T-lymphocyte surface and specifically how they cluster remains unclear, including during the early phases of initiation of immune activation in the T-cell response. The aim of this review is to investigate how receptor clustering that has been studied, can be more effectively studied in the future and what the current evidence suggests about TCR clustering/T-cell activity relationships.
Keywords
T-cell, T-lymphocyte, receptor, TCR, clustering, function, optical trapping, optical tweezers
Introduction
Although the understanding of cancer cell – T-cell interactions are just evolving, the interactions between T-cells, and more fundamentally the behaviour and role of T-cell receptors at the time of activation, most likely importantly underpins those anti-cancer actions. Cellular interactions involving T-cells are dependent upon surface cellular receptors - the T-Cell Receptor (TCR) molecules. These TCR molecules are heterodimers comprising either alpha or beta polypeptide chains bound together (αβ-TCR), occurring in approximately 95% of the TCR population; or gamma and delta polypeptide chains bound together (αβ-TCR) [1, 2]. These polypeptide chains contain the binding site for the antigen initiation of T-cell receptor signaling and T-cell activation; a CD3 molecule comprising transmembrane domains; and a cytoplasmic tail communicating with the interior of the T-cell. In immunology, the CD3 T cell co-receptor helps to activate both the cytotoxic T cell (CD8+ naive T cells) and also T helper cells (CD4+ naive T cells) responsible for immune signaling and therefore immunity [3]. Each polypeptide of the CD3 molecule contains a constant (C) and variable (V) region (Figure 1).
The constant region of a TCR is anchored within the cell membrane, while the variable region extends extracellularly and is responsible for antigen binding, whereas the short cytoplasmic tail of the TCR on its own, lacks the ability to initiate signals to activate the immune response.
Cluster of differentiation cells, including the entire protein structure of CD3, provides for this signal transduction through a combination of the ITAMs and intracytoplasmic tails [5]. This way, T-cells can mediate cell killing either by direct binding to tumor/myeloma cells, for example, or through other mechanisms such as indirectly via antibody dependent cellular cytotoxicity where antibody bound to an antigen presenting (accessory) cell can bring T-cells into proximity with tumor/myeloma cells, illustrated in (Figure 2).
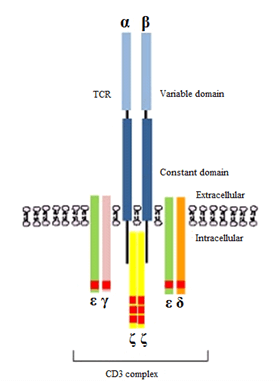
Figure 1: An illustration of a TCR heterodimer comprising alpha (α) and beta (β) polypeptide chains with each polypeptide containing a constant and a variable region. The CD3 protein consists of three pairs of dimers (εγ, εδ, ζζ) that are responsible for intracellular signaling, initiated by the phosphorylation of immunoreceptor tyrosine activation motifs (ITAMs) shown as red rectangular domains (ten in total). Source: Adopted from Bio-Rad Laboratories, Inc. [4].
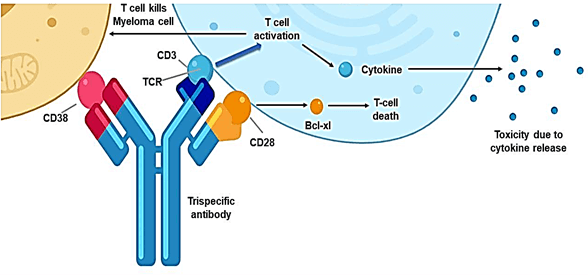
Figure 2: The design of a triple specific T-cell engager (TriTE) antibody and how it links the T cells to the targeted cancer cells. This trispecific antibody binds three targets: the CD38 protein on a myeloma cell, and the protein CD28 and the CD3 protein complex on a T cell (the antibody’s target-binding domains are shown in red, blue and yellow, respectively). CD3 is a component of the T cell receptor (TCR). The binding of CD3 by the antibody drives T cell activation without requiring antigen recognition by the TCR, which leads to the killing of the myeloma cell and the production and release of toxic cytokine molecules [6].
As schematically displayed in (Figure 3), the extent, timing, nature and influence of receptor clustering is currently unclear and is the topic of active research. Evidence suggests that TCR molecule clustering (aggregates of atoms or molecules) is largely responsible for the signal transduction process associated with subsequent TCR activation [7]. It is argued that such TCR molecule clustering influences the immune response by modifying immune mechanics [8]. This review specifically examines TCR/CD3 molecule clustering, and the techniques used to study these single cell activities. From here, future research is needed in order to advance our understanding of TCR clustering to facilitate a better understanding of how T-cell activation occurs.
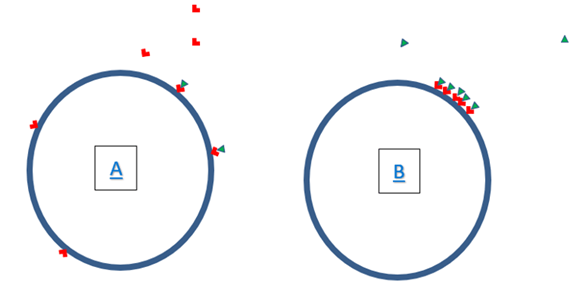
Figure 3: Schematic diagram showing (A) a cell with surface receptor distributed around surface; and (B) receptor migration where receptors and ligands cluster on the cell membrane during activation/ stimulation.

Clustering and Cell Behaviour
When antigen presenting cells activate the TCR, the TCR-mediated signals are transmitted across the cell membrane by the CD3 dimers – the chains CD3D (δ), CD3E (ε), CD3G (γ) and CD3Z (ζ). All CD3 chains contain the ITAMs in their cytoplasmic domain [9, 10]. Upon TCR engagement, these motifs become phosphorylated by protein tyrosine kinases resulting in the activation of downstream signaling pathways [8, 11].
Broadly, receptors expressed at the cell membrane surface are typically multiple and dispersed around the cell surface, capable of binding a ligand and frequently transmitting signals into the cell for a specific reaction to occur [9]. A range of receptors are present on different cells and in varying numbers depending on the cell type. Many of these receptors demonstrate mobility within the cell membrane because the cell membrane is relatively fluid in its behaviour so that receptor molecules can move to some degree within the membrane structure and can change their position. This phenomenon can allow clustering behaviour of multiple receptors which can move and aggregate in regions of the cell surface [8]. The importance of the movement of TCRs on T-cells and the role and importance of receptor clustering is currently poorly understood. Methods in fluorescence spectroscopy are used to examine the physical processes of how T-cell receptors cluster around the T-cell surface and interact.
CD3 Protein Expression and Receptor Clustering - Fluorescence Spectroscopy and Flow Cytometry
Receptor clustering into macro-clusters is regulated by cytoskeletal proteins, whose dysfunction can promote immunodeficiency, and can recruit multiple kinases as well as phosphatases for further effector function [12, 13]. Changes to these receptors can be observed by changes to their physical states. T-cell receptors often undergo different conformational and oligomeric states when engaged in clustering and influencing cellular signaling. Fluorescence spectroscopy and flow cytometry has been used to show different conformational and oligomeric states of proteins relates to receptor clustering while analysis of cellular physiological conditions can be modified and studied [8, 14].
Fluorescence spectroscopy has been shown to detect a range of diseases. For example, tumor cells in some circumstances can easily be detected by identifying altered fluorescence properties with respect to the fluorescence of ordinary normal tissues [14]. Moreover, methods in fluorescence spectroscopy and flow cytometry are also used to quantify receptor clustering by measuring changes to light energy. This is possible since receptor clustering can be quantified by gating changes to light energy of viable cells under certain physiological conditions like changes to cell temperature or density [14]. The quantification of receptor clustering by flow cytometry is based on the following two observations: first, the fluorescence signal length (FL time-of-flight [ToF]) decreases relative to the Forward Scatter Signal length (FSc-ToF), and second, the peak FL (FL-peak) increases relative to the integral FL (FL-integral) upon clustering of FL-labeled surface receptors [14]. Receptor macro-clustering (a heterogeneous association of receptors) can therefore be quantified using the ratios FL-ToF/FSc-ToF (method ToF) or FL-peak/FL-integral (method Peak) [11]. Quantification of receptor clustering provides crucial information about the current cellular state of activation, which is particularly, but not uniquely, important in the immune system [15].
Recent single cell and light induced molecular studies, used both the single point – forced single cell suspension (FSCS) and line-scanning FSCS to investigate how biophysical properties of TCR engagement result in biochemical phosphorylation events [8]. FSCS was acquired using the Zeiss 880 laser scanning confocal microscope with 488 nm and 594 nm CW lasers that were focused on the Plan-Apochromat 63x 1.4 oil objective through a dual colour dichroic mirror (488/594 nm) to simultaneously excite the basolateral membrane of immune cells. After being incubated on the indicated surface for 12 h, 106 Jurkat cells were washed and incubated with anti-human CD69 Alexa Fluor488 (310916, BioLegend) at 4°C for 30 min. Excitation of the TCR occurred when the white light laser was tuned to 488 nm and pulsing at 40 MHz. Using Fluorescence spectroscopy, Ma and colleagues found that spatial clustering of the CD3ζ intracellular tail alone was sufficient to initialize T cell triggering including phosphorylation of CD3ζ, Zap70, PLCγ, ERK and initiated Ca2+ flux. This research supports earlier single cell research [16].
Ma and colleagues also showed how fluorescence imaging allows for the detection of protein clustering with high spatial and temporal resolution [8]. Using such imaging they also found that TCR triggering increased numbers of dense TCR–CD3 clusters. However, it is claimed that while both monomeric and oligomeric peripheral Major Histocompatibility Complex (MHC) bind to the TCR, only oligomeric ligands trigger TCR signaling, suggesting that ligand-induced receptor clustering is required for activation [17, 18].
Techniques such as fluorescence spectroscopy and flow cytometry analyses offer opportunity to provide a bulk analysis of T-cell receptor clustering however, research investigating the real-time thermally-driven adhesion and dissociation between lymphocyte receptors and a ligand at a specific macromolecular level remains novel. Optical Trapping-Optical Tweezers (OT) is a technology that uses a tightly focused laser beam (an Avalanche Photodiode (APD) that is a sensitive semiconductor electronic device that converts light to an electrical signal) to allow for the real time thermally driven adhesion and dissociation between lymphocyte receptors and antigens to be studied [19]. OT is therefore a precise method for studying the geometric forces involved with receptor clustering (and therefore immune functions) using methods like statistical mechanics [19].
Optical Trapping - Optical Tweezers
Optical Tweezers have been used to study receptor-ligand binding on cells. A ligand attached to a microsphere trapped by Optical Tweezers can be brought into contact with ligands on the cell surface (also trapped by Optical Tweezers) in order to study receptor-ligand binding. In this dual trapping manner, a number of adhesion quantities like binding force, adhesion probably (the likelihood of cell-ligand binding) and steric effects (factors that affect orientation of molecules) can be [20]. Similar studies can be done in T-cell receptor binding.
Methods like Fluorescence Resonance Energy Transfer (FRET – a biophysical method that allows for the mechanical analysis of two molecules within several nanometers) can also be combined with Optical Tweezers to measure the relative distance between the receptor and ligand to better understand the dynamics of clustering of ligands on cell surfaces [19]. This process provides one to mimic closely the dynamics of a real antigen-TCR encounter and therefore how the immune response is activated at a fundamental molecular level.
Discussion
The identification and quantification of receptor clustering provides crucial information about current cellular immune state and activation. Quantification of the kinetics of receptor clustering therefore provides crucial information about the current cellular state of activation, which is particularly, but not uniquely, important in the immune system [14]. Recent studies have shown how receptor clustering is implicated in immune activation [16]. Ma and colleagues showed that fluorescence spectroscopy reveals how light induced spatial clustering of the CD3ζ intracellular tail alone was sufficient to initialize T cell triggering including phosphorylation of CD3ζ, Zap70, PLCγ, ERK and initiated Ca2+ flux. More specific methods for researching the real-time thermally driven adhesion and dissociation between lymphocyte receptor clustering in response to antigen contact can be provided by using Optical Trapping-Optical Tweezers. It has been shown that Optically Trapping single cells provides for a specific analysis of cellular mechanics in real-time thereby providing for more accurate detail about the mechanics of immune activation. This process provides one to mimic closely the dynamics of a real antigen-TCR encounter by researching receptor clustering. Determination of some of the physical properties of T-cell receptor clustering is currently being explored using optical trapping to facilitate a better understanding of the importance of this phenomenon in T-cell activation processes.
Conclusion
The detail of how TCRs physically behave on the T-lymphocyte surface and specifically how they cluster remains unclear; however, the quantification of receptor clustering provides crucial information about T-cell activation. It is this T-cell activation process which underpins the immunological action against cancer cells which is vital for immunotherapeutic effectiveness. Optical Tweezers using Optical Trapping has been used to study receptor-ligand binding on cells and subsequent receptor clustering and offers a novel approach to quantify receptor clustering and study the fundamental origins of immune activation. In a dual trapping manner, a number of adhesion quantities like binding force, adhesion probably and steric effects can be used to study receptor-ligand bonding and any subsequent receptor clustering. Many receptor molecules move within the membrane structure and can change their position. The importance of this movement of TCRs within the membrane of T-cells and the role and mechanisms of receptor clustering are essential to better understand the fundamentals of immunity and cancer immunotherapy.
Article Info
Article Type
Review ArticlePublication history
Received: Sat 24, Apr 2021Accepted: Fri 14, May 2021
Published: Mon 31, May 2021
Copyright
© 2023 Jason Paul Buttigieg. This is an open-access article distributed under the terms of the Creative Commons Attribution License, which permits unrestricted use, distribution, and reproduction in any medium, provided the original author and source are credited. Hosting by Science Repository.DOI: 10.31487/j.COR.2021.05.08
Figures & Tables
References
1.
Malissen B (2008)
CD3 ITAMs count! Nat Immunol 9: 583-584. [Crossref]
2.
Pitcher LA, van
Oers NSC (2003) T-cell receptor signal transmission: who gives an ITAM? Trends
Immunol 24: 554-560. [Crossref]
3.
Alberts B,
Johnson A, Lewis J, Raff M, Roberts K et al. (2002) Molecular Biology of the
Cell, 4th edition. Garland Sci. [Crossref]
4.
Bio-Rad
Laboratories, Inc (2016) Endeavour House. Oxfordshire.
5.
Love PE, Hayes SM
(2010) ITAM-mediated signaling by the T-cell antigen receptor. Cold Spring
Harb Perspect Biol 2: a002485. [Crossref]
6.
Guo ZS, Lotze MT,
Zhu Z, Storkus WJ, Song XT (2020) Bi- and Tri-Specific T Cell Engager-Armed
Oncolytic Viruses: Next-Generation Cancer Immunotherapy. Biomedicines 8:
204. [Crossref]
7.
Echt O, Märk TD
(1999) Encyclopedia of Spectroscopy and Spectrometry 327-336.
8.
Ma Y, Lim YJ,
Benda A, Goyette J, Gaus K (2020) Clustering of CD3ζ is sufficient to initiate
T cell receptor signaling. bioRxiv.
9.
Mariuzza RA,
Agnihotri P, Orban J (2020) The Structural basis of T Cell receptor (TCR) activation:
An enduring enigma. J Biol Chem 295: 914-925. [Crossref]
10. Song W, Liu C, Upadhyaya A (2014) The pivotal position
of the actin cytoskeleton in the initiation and regulation of B cell receptor
activation. Biochim Biophys Acta 1838: 569-578. [Crossref]
11. Fürnrohr BG, Stein M, Rhodes B, Chana PS, Schett G et
al. (2015) Reduced Fluorescence versus Forward Scatter Time-of-Flight and
Increased Peak versus Integral Fluorescence Ratios Indicate Receptor Clustering
in Flow Cytometry. J Immunol 195: 377-385. [Crossref]
12. Wary KK, Dans M, Mariotti A, Giancotti FG (1999)
Biochemical analysis of integrin-mediated Shc signaling. Methods Mol Biol
129: 35-49. [Crossref]
13. Barber EK, Dasgupta JD, Schlossman SF, Trevillyan JM,
Rudd CE (1989) The CD4 and CD8 antigens are coupled to a
protein-tyrosine kinase (p56lck) that phosphorylates the CD3 complex. Proc
Natl Acad Sci U S A 86: 3277-3281. [Crossref]
14. Giancotti FG, Ruoslahti E
(1999) Integrin signaling. Science 285: 1028-1032. [Crossref]
15. Comar WD, Schubert SM, Jastrzebska B, Palczewski K,
Smith AW (2014) Time-resolved fluorescence spectroscopy measures clustering and
mobility of a G protein-coupled receptor opsin in live cell membranes. J Am
Chem Soc 136: 8342-8349. [Crossref]
16. Ma Y, Poole K, Goyette J, Gaus K (2017) Introducing
membrane charge and membrane potential to T cell signaling. Front Immunol 8:
1513. [Crossref]
17. Boniface JJ, Rabinowitz JD, Wülfing C, Hampl J, Reich
Z et al. (1998) Initiation of signal transduction through the T cell receptor
requires the multivalent engagement of peptide/MHC ligands [corrected]. Immunity
9: 459-466. [Crossref]
18. Cochran JR, Cameron TO, Stern LJ (2000) The
relationship of MHC-peptide binding and T cell activation probed using
chemically defined MHC class II oligomers. Immunity 12: 241-250. [Crossref]
19. Buttigieg JP, Helmerson K, Coventry BJ (2018) Impact
of Physics in Family Health Care: Fluorescence Spectroscopy. J Fam Med Dis
Prev 3: 051.
20. Fan D, Sakai Y, Chelikowsky JR (2020) Chemical and
steric effects in simulating noncontact atomic force microscopy images of
organic molecules on a Cu (111) substrate. Phys Rev Materials 4: 053802.