The Cumulative Perioperative Model: Predicting 30-Day Mortality in Abdominal Surgery Cancer Patients
A B S T R A C T
Objectives: 1) To develop a cumulative perioperative model (CPM) using the hospital clinical course of abdominal surgery cancer patients that predicts 30 and 90-day mortality risk; 2) To compare the predictive ability of this model to ten existing other models.
Materials and Methods: We constructed a multivariate logistic regression model of 30 (90)-day mortality, which occurred in 106 (290) of the cases, using 13,877 major abdominal surgical cases performed at the University of Texas MD Anderson Cancer Center from January 2007 to March 2014. The model includes race, starting location (home, inpatient ward, intensive care unit or emergency center), Charlson Comorbidity Index, emergency status, ASA-PS classification, procedure, surgical Apgar score, destination after surgery (hospital ward location) and delayed intensive care unit admit within six days. We computed and compared the model mortality prediction ability (C-statistic) as we accumulated features over time.
Results: We were able to predict 30 (90)-day mortality with C-statistics from 0.70 (0.71) initially to 0.87 (0.84) within six days postoperatively.
Conclusion: We achieved a high level of model discrimination. The CPM enables a continuous cumulative assessment of the patient’s mortality risk, which could then be used as a decision support aid regarding patient care and treatment, potentially resulting in improved outcomes, decreased costs and more informed decisions.
Keywords
Regression analysis, perioperative period, mortality, decision support techniques
Introduction
There has been an increase in the amount of digital information stored in electronic health records associated with each patient encounter [1]. Typically, outcomes have been associated with data at one time point. To improve on this, we looked at a patient’s hospital surgical course over several time points, reflecting an ongoing clinical picture. Administrative data (such as age, gender, and race) provides a starting point [2]. With major elective surgeries, more information is available preoperatively. Two common comorbidity scores adjusting preoperative risk, beneficial in predicting 30-day complications in surgical patients are the Charlson Comorbidity Index (CCI) and the American Society of Anesthesiology Physical Status (ASA-PS) [3-11]. Together, the CCI and ASA-PS have shown to be useful in predicting complications [12, 13].
The Surgical Apgar Score (SAS) was developed and validated as a simple objective assessment of a patient’s postoperative condition and has been shown to correlate with adverse outcomes [14-18]. The postoperative destination [home, hospital ward or Intensive Care Unit (ICU)] is usually determined preoperatively and has not been well studied as a possible risk factor for outcomes. Furthermore, delayed ICU admission indicates an increased level of care is needed and could be inferred to be associated with poor outcomes. Numerous other specialized and general scores have been developed that predict morbidity and mortality at varying points in the future for different subsets of patients.
We developed a Cumulative Perioperative Model (CPM) that incorporates patient information available as the patient received perioperative care. The CPM predicts 30 and 90-day mortality in cancer patients undergoing abdominal surgery. We follow the patients throughout their clinical course and update the prediction at each logical time step. We use cumulative, easily calculated features based on available knowledge to predict mortality. We compared our model’s predictive ability to single time point alternatives: the CCI, the SAS, the ASA-PS, the Elixhauser measure, Quan’s CCI and Elixhauser variants, the Risk Stratification Index (RSI), the Risk Quantification Index (RQI), Le Manach’s Perioperative Score to Predict Postoperative Mortality (POSPOM), and the Surgical Mortality Probability Model (S-MPM) [3, 7, 14, 19-25].
Methods
Both the University of Texas MD Anderson Cancer Center and Rice University Institutional Review Boards approved this research and waived the need for informed patient consent.
I Study Population
This research was based on 81,196 surgical patients treated at MD Anderson between January 2007 and March 2014. MD Anderson is a Comprehensive Cancer Center located in Houston, Texas. We studied adult patients undergoing major abdominal surgery, including all major procedures below the diaphragm and above the pelvic floor, whether intraperitoneal or extraperitoneal. 2,791 cases involved multiple procedures. Our data sources were administrative billing and procedure codes as well as surgical data from the Anesthesia Information Management System and the hospital's nightly census.
II Study Design
We built models of 30- and 90-day mortality for cancer patients undergoing major abdominal surgery that improves in predictive ability over time as we learn more about each patient. We started with demographic information and added features as the patient arrived for surgery and progressed through the operating theater and perioperative stay until the sixth postoperative day. At each point, we added the newly available features to the cumulative model and re-predicted. Figure 1 shows the points of interest around the perioperative period. In this diagram, for example, a patient arrived from home on the morning of surgery (1), had the operation (2), recovered for a few hours in the PACU (3), and then was admitted to a ward for further recovery and observation (4). One week later, the patient returned home (5).
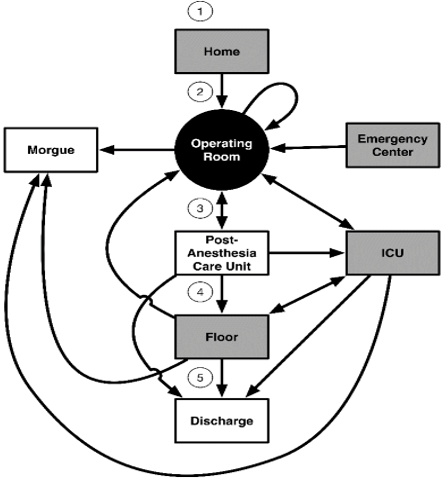
Figure 1: Relevant perioperative patient course through the hospital. Shaded boxes are starting locations.
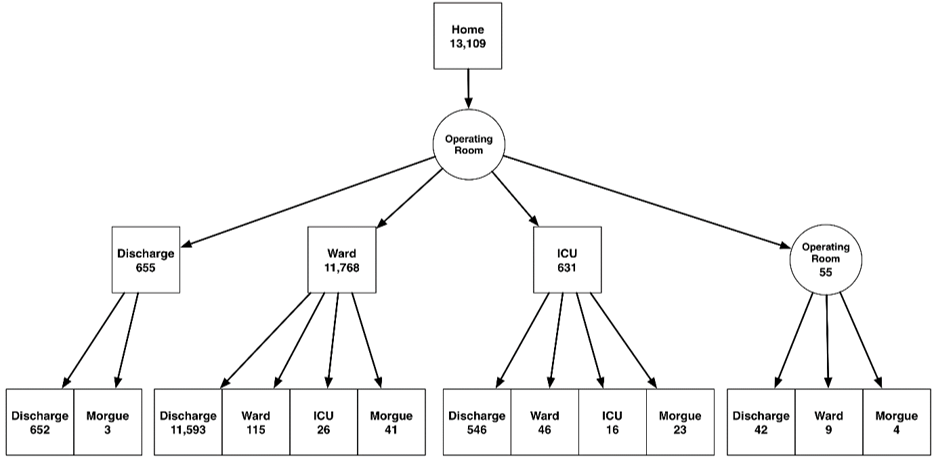
Figure 2: Destinations and quantities of abdominal surgery patients who started at home. The bottom row shows the patients' 30-day location.
We considered four different starting points for the cases, as shown in (Figure 1). These locations include arrivals from home or via the emergency center and two inpatient locations, the ICU and the hospital ward. From these starting points, the patients proceeded to the operating room, and then either returned immediately to surgery, were sent to the ICU, went to the PACU or were sent to the morgue. In our dataset, only one patient died during surgery. Figure 2 shows the number of patients who started at home on the day of surgery, the patients' surgical destination and 30 (90)-day status. The supplemental material includes analogous diagrams starting from the Emergency Center, hospital ward and ICU.
III Incremental Steps and Features
Rather than rely on a single time point, we evaluated patients as they went through the “process of care” and leveraged that information to build a cumulative perioperative model to identify patients with higher mortality risk. The time points during the patient’s clinical course were as follows:
i. When surgery is scheduled
ii. The morning of surgery
iii. When the procedures are complete
iv. When anesthesia is complete
v. After leaving the PACU
vi. Six days postoperative
We considered a number of patient demographic and case data for our predictive model, as listed in (Table 1). We determined procedures performed from CPT codes recorded in the electronic health record and comorbidities from ICD-9 codes.
Table 1: Major Abdominal Surgery patient characteristics.
|
Characteristic |
Training |
Evaluation |
Total |
|
Number of cases |
9,251 |
4,626 |
13,877 |
|
30-day mortalities # / % |
69 / 0.75% |
37 / 0.80% |
106 / 0.76% |
|
90-day mortalities # / % |
204 / 2.21% |
86 / 1.86% |
290 / 2.09% |
|
Age, median (IQR), years |
59.9(43.4, 63.8) |
59.8(43.3, 63.9) |
59.9(43.3, 63.8) |
|
Male gender, % |
45 |
47 |
46 |
|
Race/ethnicity, % |
|
|
|
|
White |
73.2 |
73.4 |
73.3 |
|
Black |
7.8 |
7.9 |
7.9 |
|
Hispanic |
13.2 |
13.1 |
13.2 |
|
Other |
5.8 |
5.6 |
5.7 |
|
BMI |
|
|
|
|
< 18.5 |
1.4% |
1.6% |
1.4% |
|
>= 18.5, < 25 |
26.4% |
26.7% |
26.5% |
|
>= 25, < 30 |
34.0% |
33.0% |
33.6% |
|
>= 30, < 35 |
21.4% |
22.6% |
21.8% |
|
>= 35, < 40 |
9.4% |
9.3% |
9.4% |
|
> 40 |
7.4% |
6.9% |
7.2% |
|
Charlson Index, median (IQR) |
5 (2,8) |
5 (2,8) |
5 (2,8) |
|
Start Location, % |
|
|
|
|
Home |
94.3 |
94.7 |
94.5 |
|
Ward |
5.0 |
4.6 |
4.9 |
|
EC |
0.5 |
0.4 |
0.5 |
|
ICU |
0.2 |
0.3 |
0.2 |
|
Emergency Status, % |
1.1 |
1.0 |
1.1 |
|
ASA Score, median, (IQR) |
3 (1,3) |
3 (1,3) |
3 (1,3) |
|
Scheduled admit type % |
|
|
|
|
Out-patient |
1.5 |
1.8 |
1.6 |
|
Observation Unit |
1.3 |
1.4 |
1.4 |
|
Same Day Admit |
91.9 |
91.7 |
91.8 |
|
In-patient |
5.2 |
5.0 |
5.1 |
|
Unknown |
0.1 |
0 |
0.1 |
|
Presurgical LOS, median (IQR), years |
0 (0,0) |
0 (0,0) |
0 (0,0) |
|
Procedures, # / % of total procedures |
|
|
|
|
Nephrectomy |
2,024 |
1,009 |
3,033 / 19.4% |
|
Colectomy |
2,000 |
938 |
2,938 / 18.8% |
|
Hysterectomy |
1,644 |
781 |
2,425 / 15.5% |
|
Hepatectomy |
1,088 |
539 |
1,627 / 10.4% |
|
Cystectomy |
862 |
455 |
1,317 / 8.4% |
|
Pancreatectomy |
676 |
331 |
1,007 / 6.5% |
|
Enterectomy |
501 |
259 |
760 / 4.9% |
|
Oophorectomy |
394 |
207 |
601 / 3.9% |
|
Splenectomy |
260 |
119 |
379 / 2.4% |
|
Jejunostomy |
208 |
129 |
337 / 2.2% |
|
Enterostomy |
201 |
120 |
321 / 2.1% |
|
Adrenalectomy |
211 |
99 |
310 / 2.0% |
|
Gastrectomy |
190 |
95 |
290 / 1.9% |
|
Pelvic exenteration |
100 |
70 |
170 / 1.1% |
|
Enteroenterostomy |
56 |
32 |
88 / 0.6% |
|
Surgical Apgar score, median (IQR) |
7 (5,7) |
7 (5,7) |
7 (5,7) |
|
Extended PACU stay, % |
6.4 |
6.0 |
6.3 |
|
Patient Location on Day 7 |
|
|
|
|
Home |
5024 |
2507 |
7531 / 54.3% |
|
Home Care |
193 |
90 |
283 / 2.0% |
|
Institutional Care |
14 |
6 |
20 / 0.1% |
|
PACU |
9 |
3 |
12 / 0.1% |
|
Hospital Ward |
3833 |
1915 |
5748 / 41.4% |
|
ICU |
166 |
97 |
263 / 1.9% |
|
Hospice |
0 |
0 |
0 / 0 % |
|
Morgue |
12 |
8 |
20 / 0.1% |
|
Post-operative Length of stay, median (days) |
7.7 |
7.6 |
7.7 |
At the time surgery is scheduled, we know the patient's age, gender, race, comorbidities and the scheduled procedure. To reflect each patient's comorbidities, we used the CCI [3]. The CCI is a weighted sum of 19 key comorbidities, each assigned a weight of 1, 2, 3 or 6 [3]. For consistency, we use Deyo's mapping of the comorbidities to ICD-9 codes [26]. By the morning of surgery, we know the patient's ASA-PS classification, whether or not the surgery is emergent, and where the patient was prior to surgery (home, on an inpatient ward, in the ICU, or in the emergency center).
We took two steps to model what occurred in the operating room. First, we looked at which abdominal procedures were performed, and once anesthesia ended, we included the patient's SAS. Next, we incorporated the patient's surgical destination (discharge, inpatient ward, ICU, return to surgery). Finally, we looked forward to six days to identify the patient’s location (home, ICU, institutional care, etc.). We discarded features that either had no discrimination (e.g., whether or not the patient had a splenectomy) or if the feature did not improve the C-statistic for the step (e.g., extended PACU stays).
IV Outcome Measures
We evaluated our model's ability to predict 30 and 90-day mortality using the C-statistic, or area under the receiver operating characteristic curve (AUROC). This metric reflects a model's discriminative ability, with a value of 0.5 equivalent to a random or coin-flip classifier, and a value of 1 indicating a perfect ability to segregate positive cases from negative. Mortality was determined either by discharge status within 30 (90) days or by records indicating the date of last contact and status. In addition, the presence of any patient information past 30 (90) days postoperative, indicated survival.
V Comparisons with Other Predicting Models
We implemented the time point assessment scores as described in their respective papers, with a few exceptions. Since we did not have access to the planned surgical procedures, we used the actual procedure performed in the POSPOM model. With regard to the S-MPM model, not all of the procedures in our study were included in the S-MPM model. Therefore, we assigned the missing procedures to high, intermediate, or low risk categories based on our medical expertise and judgment. We also changed the categorization of pelvic exenteration from low-risk (all gynecologic procedures) to high-risk, based on how this procedure is performed at MD Anderson. We compared our models’ predictive ability to single time point alternatives: the CCI, the SAS, the ASA-PS, the Elixhauser measure, Quan’s CCI and Elixhauser variants, RQI, RSI, the POSPOM, and the S-MPM [3, 7, 14, 19-25].
The RQI composite major morbidity/mortality risk estimate includes a Procedure Severity Score for mortality, ASA-PS, and hospitalization type (in or out-patient) [23]. To calculate the RQI in cases with multiple procedures, we selected the procedure with the highest weight. The Risk Stratification Index (RSI) uses procedure and diagnosis codes to predict a patient's hospital length of stay and mortality [22]. Both the RQI and the RSI predict 30-day mortality and cover a broad spectrum of patients and conditions. The S-MPM categorizes surgeries into three tiers based on risk and utilizes the ASA-PS and emergency status of the operation [25]. The S-MPM was developed using 298,772 patients undergoing noncardiac surgery from the National Surgical Quality Improvement Program (NSQIP). SAS, a 10-point score that predicts 30-day mortality and major surgical complications, was developed and validated on both colectomy and general and vascular procedures use estimated blood loss, lowest heart rate and lowest surgical mean arterial pressure [14]. Combining available patient information prior to the procedure, Le Manach et al.’s POSPOM score uses demographics and comorbidities in conjunction with the surgery category [24]. While the POSPOM score was intended to predict in-hospital mortality, we used it to predict 30 and 90-day mortality.
VI Statistical Methods
Two-thirds of the patients (9,251) were randomly assigned to the training cohort and the remaining (4,625) to evaluation. The predictive model was built using the training cohort and evaluated on the evaluation cohort. Our model is a multivariate logistic regression model. In the first step, we selected the demographic and comorbidity features that, combined, produced the highest C-statistic. Afterward, we added discriminative features by the time available, using forward feature selection, retaining any discriminating candidate feature that increased the C-statistic.
Prior to computing the SAS, we removed outlier values from the vital sign data. We treated heart rates less than 40 beats per minute as artifact and calculated the mean blood pressure (MBP) from systolic (SBP) and diastolic (DBP) values.
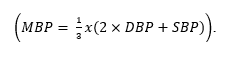
We required the SBP to be at least 40 mmHg and the diastolic to be at least 28 mm Hg. Furthermore, we required a minimum 12-point difference between the two readings. In an effort to simplify the CPM and improve predictability, we also reduced the 10-point scale to the top six values. Our final values for the surgical Apgar score are less than 5, 6, 7, 8, 9 and 10. Finally, at each time step, we remove all patients in the evaluation set that have died. We computed confidence intervals using standard error calculations, as proposed by Hanley and McNeil [27].
Results
Overall, there was a 0.76% (2.09%) 30 (90)-day mortality rate for these cases. The patients' median SAS was 7, and 6% of patients were in the post-anesthesia care unit (PACU) overnight. Typical postoperative lengths of stay were 7.6 days, and 2% of patients were admitted to the ICU after first being in an inpatient ward. Patients were typically in their late sixties, with a fairly even mix of men and women. Over 98% of the cases were elective, with over 94% of the patients arriving from home the day of surgery. Approximately 5% of the patients were already inpatients, and a small number (~0.5%) arrived at surgery via the hospital emergency center. Table 1 shows our patients’ characteristics. Table 2 lists the exact feature values used in the models and the univariate C-statistic for each candidate feature. For the 30-day CPM model, the most significant independent predictors of outcome were the CCI (0.69), SAS (0.76), and surgical destination (0.72).
Table 2: Discrete Feature Values used in the Cumulative Perioperative Model associated with each cumulative step and their univariate ability to predict mortality.
|
Time step |
Feature |
Values |
C-statistic for 30-day mortality |
Cumulative C-statistic for 30-day mortality |
C-statistic for 90-day mortality |
Cumulative C-statistic for 90-day mortality |
|
|
1. Procedure Scheduled |
Gender |
{Female, Male} |
0.56 |
- |
0.56 |
- |
|
|
|
Race |
{White, Black, Hispanic, Other} |
0.58 |
- |
0.49 |
- |
|
|
|
Age |
numeric |
0.58 |
- |
0.60 |
- |
|
|
|
BMI |
6 groups |
0.46 |
|
0.55 |
|
|
|
|
Charlson Comorbidity Index |
Discrete values from 0 - 20, inclusive |
0.69 |
|
0.69 |
|
|
|
Best step 1 features |
Race + CCI |
|
0.70 |
Gender + CCI |
0.71 |
||
|
2. Morning of surgery |
Start location |
{Home, Ward, ICU, EC} |
0.61 |
|
0.61 |
|
|
|
|
Emergency status |
{Absent, Present} |
0.58 |
|
0.57 |
|
|
|
|
ASA classification |
Numeric: {1,2,3,4,5} |
0.65 |
|
0.62 |
|
|
|
|
Best step 1 & all step 2 features |
|
0.76 |
0.78 |
|||
|
3. Procedures complete |
Adrenalectomy |
{Absent, Present} |
0.49 |
Excluded |
0.49 |
Excluded |
|
|
|
Colectomy |
{Absent, Present} |
0.48 |
Excluded |
0.52 |
|
|
|
|
Cystectomy |
{Absent, Present} |
0.54 |
|
0.53 |
|
|
|
|
Enterectomy |
{Absent, Present} |
0.57 |
|
0.55 |
|
|
|
|
Enteroenterostomy |
{Absent, Present} |
0.51 |
|
0.52 |
|
|
|
|
Enterostomy |
{Absent, Present} |
0.53 |
|
0.53 |
|
|
|
|
Gastrectomy |
{Absent, Present} |
0.50 |
Excluded |
0.49 |
Excluded |
|
|
|
Hepatectomy |
{Absent, Present} |
0.48 |
Excluded |
0.52 |
|
|
|
|
Hysterectomy |
{Absent, Present} |
0.57 |
|
0.57 |
|
|
|
|
Jejunostomy |
{Absent, Present} |
0.51 |
|
0.51 |
|
|
|
|
Nephrectomy |
{Absent, Present} |
0.48 |
Excluded |
0.51 |
|
|
|
|
Oophorectomy |
{Absent, Present} |
0.50 |
Excluded |
0.51 |
|
|
|
|
Pancreatectomy |
{Absent, Present} |
0.52 |
|
0.51 |
|
|
|
|
Pelvic exenteration |
{Absent, Present} |
0.51 |
|
0.51 |
|
|
|
|
Splenectomy |
{Absent, Present} |
0.50 |
Excluded |
0.50 |
Excluded |
|
|
|
Best step 1, all step 2, & discriminative step 3 features |
0.79 |
0.78 |
||||
|
4. Anesthesia complete |
Surgical Apgar score |
{≤5, 6, 7, 8, 9, 10} |
0.76 |
0.84 |
0.70 |
0.82 |
|
|
5. Post PACU |
Extended PACU |
{Absent, Present} |
0.52 |
Excluded |
0.52 |
Excluded |
|
|
|
Surgical destination |
{Discharge, Ward, ICU, Surgery} |
0.72 |
0.86 |
0.63 |
0.82 |
|
|
6. Six days post-operative |
Delayed ICU admit |
{Home, Home Care, Institutional Care, PACU, Hospital Ward, ICU} |
0.56 |
0.87 |
0.53 |
0.84 |
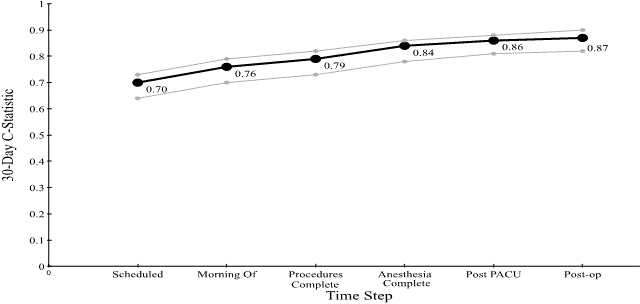
Figure 3: C-statistic for the Cumulative Perioperative Model Predicting 30-Day Mortality, with Confidence Intervals.
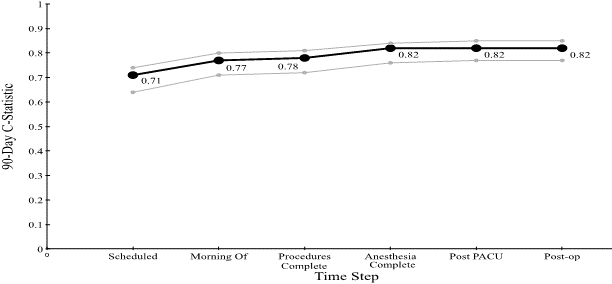
Figure 4: C-statistic for the Cumulative Perioperative Model Predicting 90-Day Mortality, with Confidence Intervals.
Figures 3 & 4 show the C-statistic for predicting (30 and 90-day) mortality generated by our model at each time step: when the case is scheduled; the morning of the surgery; after procedure completion; at anesthesia end; post PACU, and six days postoperatively. The 30-day C-statistic starts with a value of 0.70 and increases, basically linearly, as time progresses, to a value of 0.87.
Table 3 shows the results from the point-in-time models as well as the CPM model at each point in time. As can be seen, the C-statistic improves over time and outperforms the other models at each step.
Table 3: Comparison of 30-day and 90-day mortality predictions by all models, in time order.
|
Model |
30-day Mortality |
90-day Mortality |
|
1. Procedure Scheduled |
||
|
CPM |
0.70 |
0.71 |
|
CCI |
0.69 |
0.69 |
|
Quan CCI |
0.71 |
0.68 |
|
Elixhauser |
0.71 |
0.73 |
|
Quan Elixhauser |
0.68 |
0.69 |
|
2. Morning of surgery |
||
|
CPM |
0.76 |
0.78 |
|
ASA |
0.65 |
0.62 |
|
POSPOM |
0.63 |
0.65 |
|
3. Procedures complete |
||
|
CPM |
0.79 |
0.78 |
|
S-MPM |
0.72 |
0.68 |
|
RSI |
0.58 |
0.67 |
|
RQI |
0.70 |
0.71 |
|
4. Anesthesia complete |
||
|
CPM |
0.84 |
0.82 |
|
SAS |
0.76 |
0.70 |
Discussion
In this study, we confirmed the hypothesis that by adding time-based features to a cumulative model, we are better able to predict 30 (90)-day mortality in cancer patients undergoing abdominal surgery. The 30-day mortality rate is only 0.80% in our evaluation set, which makes this prediction problem difficult. Given this prevalence, obtaining a C-statistic of 0.70 (0.71) before surgery begins, 0.84 (0.82) after anesthesia, and 0.86 (0.82) post PACU is quite remarkable, especially considering the small and easily obtainable features required [28]. Additionally, the model performed well above the other ten other available models starting the morning of surgery and better than the other models postoperatively.
A number of predictive scores have been developed specifically for the surgical population. Once the procedure is scheduled, comorbidity information is available, which may be used for computing mortality scores. The foremost comorbidity indexes are the CCI and the Elixhauser score [3, 20]. While originally developed for longer-term forecasts, the CCI is commonly used to assess a patient's mortality risk [29, 30]. Since their formation, numerous updates and variants of the CCI and Elixhauser scores have been implemented [26, 31-34]. We considered using the Elixhauser score measures in lieu of the CCI, as they are based on a larger population and frequently outperform the CCI [35-37].
However, the CCI is simpler to compute, as there are no rules to follow regarding which comorbidities to include. In addition, the CCI reduces the comorbidities to a single score instead of the up to 30 features used by the Elixhauser score [3, 20]. Instead, we compare the use of the Elixhauser score to predict 30 and 90-day mortality independently and compare this model with the CPM. The ASA-PS has been shown prospectively to strongly correlate with surgical outcomes, including mortality, with higher scores associated with higher incidences of poor outcomes [38].
Using the CPM alone, we obtained a C-statistic of 0.87 for predicting 30-day mortality, on par with the most predictive individual features in our model. Since the RQI uses the patient's primary procedure, it is most likely better suited to a patient population where only one procedure is performed at a time. In our cohort, over 20% of the cases had multiple procedures. Using the covariates provided by Sessler et al. (RSI), we calculated the C-statistic for in-hospital mortality (coefficients were not available for 30-day mortality) and obtained a C-statistic of 0.58 using our evaluation data. This value is significantly less predictive than using the CCI alone on our patients. While the RSI model is based on over 17 million Medicare patients, it excludes patients younger than 65 and requires the use of many different codes, consisting of 187 regression coefficients. It performed reasonably well on our patient cohort but did not outperform key individual predictors.
Both the RSI and RQI were designed for large, heterogeneous populations. They use a significant number of diagnosis and/or procedure codes, often with subtle differences and weights. Conversely, the CPM includes commonly available and easily computable patient information. For example, we require a simple Yes/No answer to whether or not one of six key procedures (represented by 36 CPT codes present in our dataset) was performed. The most complex calculations for the CPM are the CCI and the SAS. Patients in our cohort are very similar in terms of the feature values used by the RSI and RQI models, driving the need for a more specific model such as the CPM, which is better able to differentiate patients.
The most important features contributing to poor prognosis in both models are starting in the EC or ICU, emergent status (90-day), and being in the ICU six days postoperatively (30-day). The most significant features indicating better prognosis are starting from home on the day of surgery and going to the hospital ward after surgery. These findings, while intuitive, enable earlier and more accurate predictions of outcomes based on specific patient characteristics within a cohort of similar patients. These model-based predictions can be the starting point for engaging the patient and families in the decision-making process during discussions about prognosis or progression of disease and could help physicians review and impact clinical courses and outcomes for similar patients. This risk assessment could be used at every step along the way to support clinical decisions or adjust the level of patient care and oversight.
Our study does have limitations. It is retrospective and is a single-site study which limits the generalizability to other centers. Further, we may be missing information on follow-up care for some patients as MD Anderson often treats visiting patients. Missing follow-ups may result in inaccuracies in the mortality count. However, since the surgeries considered are major, we expect a relatively high level of follow-up. In addition, many of the predictive models were not intended to predict 30- or 90-day mortality but were tuned to predict in-hospital mortality (POSPOM) or included significant morbidities as well. We did not address how the information might affect clinical decision making [39].
Finally, we are planning to further refine the model using more sophisticated techniques and additional features to increase the predictive ability sooner, providing earlier insight into patients at risk. There are additional features that we believe would add to the predictive power of this model, in particular, primary diagnosis and disease stage, to allow adjustments for cancer progression. Once the patient reaches the ICU, adding the APACHE and/or SOFA scores are likely to improve predictions. We would also like to incorporate the discharge destination and predict additional complications (e.g., acute coronary syndrome, stroke).
Conclusion
We have developed a cumulative perioperative model (CPM) that re-evaluates a patient's state over time. This model increases in predictive capability as we follow patients through the hospital. The CPM demonstrates the value of using time-dependent information from the patient’s perioperative clinical course and could be used to identify patients who would benefit from different treatments or postoperative levels of monitoring. This tool enables an earlier assessment of patient risk, which could then be used as a decision support aid regarding care and treatment, potentially resulting in improved outcomes, decreased costs, and more informed decisions.
Summary
Prior to this research, the following was known: Single point in time risk scores can be used to predict a patient’s complication and/or mortality risk.
This study added to our knowledge: Continuous models that incorporate additional information throughout a patient’s surgical course increase the ability to predict mortality risk for cancer patients undergoing abdominal surgery.
Acknowledgements
The authors would like to thank MD Anderson employee Georgia Lange MPH, who provided invaluable assistance in obtaining the source data. The study was supported in part by the National Institutes of Health through Cancer Center Support Grant P30CA016672. Risa Myers was supported in part by a training fellowship from the Keck Center of the Gulf Coast Consortia, on Rice University's NLM Training Program in Biomedical Informatics (grant number T15LM007093) and by the NSF under grant number 0964526.
Author Contributions
RBM and JRR conceived of the presented idea. RBM and CMJ developed the theory, performed the computations and verified the analytical methods. JNL encouraged RBM and JRR to investigate published models and supervised the findings of this work. All authors discussed the results and contributed to the final manuscript.
Conflicts of Interest
The authors whose names are listed certify that they have no affiliations with or involvement in any organization or entity with any financial interest (such as honoraria; educational grants; participation in speakers’ bureaus; membership, employment, consultancies, stock ownership, or other equity interest; and expert testimony or patent-licensing arrangements), or non-financial interest (such as personal or professional relationships, affiliations, knowledge or beliefs) in the subject matter or materials discussed in this manuscript.
Article Info
Article Type
Research ArticlePublication history
Received: Mon 17, Feb 2020Accepted: Mon 02, Mar 2020
Published: Tue 10, Mar 2020
Copyright
© 2023 Joseph L Nates . This is an open-access article distributed under the terms of the Creative Commons Attribution License, which permits unrestricted use, distribution, and reproduction in any medium, provided the original author and source are credited. Hosting by Science Repository.DOI: 10.31487/j.JSO.2020.01.10
Figures & Tables
Table 1: Major Abdominal Surgery patient characteristics.
|
Characteristic |
Training |
Evaluation |
Total |
|
Number of cases |
9,251 |
4,626 |
13,877 |
|
30-day mortalities # / % |
69 / 0.75% |
37 / 0.80% |
106 / 0.76% |
|
90-day mortalities # / % |
204 / 2.21% |
86 / 1.86% |
290 / 2.09% |
|
Age, median (IQR), years |
59.9(43.4, 63.8) |
59.8(43.3, 63.9) |
59.9(43.3, 63.8) |
|
Male gender, % |
45 |
47 |
46 |
|
Race/ethnicity, % |
|
|
|
|
White |
73.2 |
73.4 |
73.3 |
|
Black |
7.8 |
7.9 |
7.9 |
|
Hispanic |
13.2 |
13.1 |
13.2 |
|
Other |
5.8 |
5.6 |
5.7 |
|
BMI |
|
|
|
|
< 18.5 |
1.4% |
1.6% |
1.4% |
|
>= 18.5, < 25 |
26.4% |
26.7% |
26.5% |
|
>= 25, < 30 |
34.0% |
33.0% |
33.6% |
|
>= 30, < 35 |
21.4% |
22.6% |
21.8% |
|
>= 35, < 40 |
9.4% |
9.3% |
9.4% |
|
> 40 |
7.4% |
6.9% |
7.2% |
|
Charlson Index, median (IQR) |
5 (2,8) |
5 (2,8) |
5 (2,8) |
|
Start Location, % |
|
|
|
|
Home |
94.3 |
94.7 |
94.5 |
|
Ward |
5.0 |
4.6 |
4.9 |
|
EC |
0.5 |
0.4 |
0.5 |
|
ICU |
0.2 |
0.3 |
0.2 |
|
Emergency Status, % |
1.1 |
1.0 |
1.1 |
|
ASA Score, median, (IQR) |
3 (1,3) |
3 (1,3) |
3 (1,3) |
|
Scheduled admit type % |
|
|
|
|
Out-patient |
1.5 |
1.8 |
1.6 |
|
Observation Unit |
1.3 |
1.4 |
1.4 |
|
Same Day Admit |
91.9 |
91.7 |
91.8 |
|
In-patient |
5.2 |
5.0 |
5.1 |
|
Unknown |
0.1 |
0 |
0.1 |
|
Presurgical LOS, median (IQR), years |
0 (0,0) |
0 (0,0) |
0 (0,0) |
|
Procedures, # / % of total procedures |
|
|
|
|
Nephrectomy |
2,024 |
1,009 |
3,033 / 19.4% |
|
Colectomy |
2,000 |
938 |
2,938 / 18.8% |
|
Hysterectomy |
1,644 |
781 |
2,425 / 15.5% |
|
Hepatectomy |
1,088 |
539 |
1,627 / 10.4% |
|
Cystectomy |
862 |
455 |
1,317 / 8.4% |
|
Pancreatectomy |
676 |
331 |
1,007 / 6.5% |
|
Enterectomy |
501 |
259 |
760 / 4.9% |
|
Oophorectomy |
394 |
207 |
601 / 3.9% |
|
Splenectomy |
260 |
119 |
379 / 2.4% |
|
Jejunostomy |
208 |
129 |
337 / 2.2% |
|
Enterostomy |
201 |
120 |
321 / 2.1% |
|
Adrenalectomy |
211 |
99 |
310 / 2.0% |
|
Gastrectomy |
190 |
95 |
290 / 1.9% |
|
Pelvic exenteration |
100 |
70 |
170 / 1.1% |
|
Enteroenterostomy |
56 |
32 |
88 / 0.6% |
|
Surgical Apgar score, median (IQR) |
7 (5,7) |
7 (5,7) |
7 (5,7) |
|
Extended PACU stay, % |
6.4 |
6.0 |
6.3 |
|
Patient Location on Day 7 |
|
|
|
|
Home |
5024 |
2507 |
7531 / 54.3% |
|
Home Care |
193 |
90 |
283 / 2.0% |
|
Institutional Care |
14 |
6 |
20 / 0.1% |
|
PACU |
9 |
3 |
12 / 0.1% |
|
Hospital Ward |
3833 |
1915 |
5748 / 41.4% |
|
ICU |
166 |
97 |
263 / 1.9% |
|
Hospice |
0 |
0 |
0 / 0 % |
|
Morgue |
12 |
8 |
20 / 0.1% |
|
Post-operative Length of stay, median (days) |
7.7 |
7.6 |
7.7 |
Table 2: Discrete Feature Values used in the Cumulative Perioperative Model associated with each cumulative step and their univariate ability to predict mortality.
|
Time step |
Feature |
Values |
C-statistic for 30-day mortality |
Cumulative C-statistic for 30-day mortality |
C-statistic for 90-day mortality |
Cumulative C-statistic for 90-day mortality |
|
|
1. Procedure Scheduled |
Gender |
{Female, Male} |
0.56 |
- |
0.56 |
- |
|
|
|
Race |
{White, Black, Hispanic, Other} |
0.58 |
- |
0.49 |
- |
|
|
|
Age |
numeric |
0.58 |
- |
0.60 |
- |
|
|
|
BMI |
6 groups |
0.46 |
|
0.55 |
|
|
|
|
Charlson Comorbidity Index |
Discrete values from 0 - 20, inclusive |
0.69 |
|
0.69 |
|
|
|
Best step 1 features |
Race + CCI |
|
0.70 |
Gender + CCI |
0.71 |
||
|
2. Morning of surgery |
Start location |
{Home, Ward, ICU, EC} |
0.61 |
|
0.61 |
|
|
|
|
Emergency status |
{Absent, Present} |
0.58 |
|
0.57 |
|
|
|
|
ASA classification |
Numeric: {1,2,3,4,5} |
0.65 |
|
0.62 |
|
|
|
|
Best step 1 & all step 2 features |
|
0.76 |
0.78 |
|||
|
3. Procedures complete |
Adrenalectomy |
{Absent, Present} |
0.49 |
Excluded |
0.49 |
Excluded |
|
|
|
Colectomy |
{Absent, Present} |
0.48 |
Excluded |
0.52 |
|
|
|
|
Cystectomy |
{Absent, Present} |
0.54 |
|
0.53 |
|
|
|
|
Enterectomy |
{Absent, Present} |
0.57 |
|
0.55 |
|
|
|
|
Enteroenterostomy |
{Absent, Present} |
0.51 |
|
0.52 |
|
|
|
|
Enterostomy |
{Absent, Present} |
0.53 |
|
0.53 |
|
|
|
|
Gastrectomy |
{Absent, Present} |
0.50 |
Excluded |
0.49 |
Excluded |
|
|
|
Hepatectomy |
{Absent, Present} |
0.48 |
Excluded |
0.52 |
|
|
|
|
Hysterectomy |
{Absent, Present} |
0.57 |
|
0.57 |
|
|
|
|
Jejunostomy |
{Absent, Present} |
0.51 |
|
0.51 |
|
|
|
|
Nephrectomy |
{Absent, Present} |
0.48 |
Excluded |
0.51 |
|
|
|
|
Oophorectomy |
{Absent, Present} |
0.50 |
Excluded |
0.51 |
|
|
|
|
Pancreatectomy |
{Absent, Present} |
0.52 |
|
0.51 |
|
|
|
|
Pelvic exenteration |
{Absent, Present} |
0.51 |
|
0.51 |
|
|
|
|
Splenectomy |
{Absent, Present} |
0.50 |
Excluded |
0.50 |
Excluded |
|
|
|
Best step 1, all step 2, & discriminative step 3 features |
0.79 |
0.78 |
||||
|
4. Anesthesia complete |
Surgical Apgar score |
{≤5, 6, 7, 8, 9, 10} |
0.76 |
0.84 |
0.70 |
0.82 |
|
|
5. Post PACU |
Extended PACU |
{Absent, Present} |
0.52 |
Excluded |
0.52 |
Excluded |
|
|
|
Surgical destination |
{Discharge, Ward, ICU, Surgery} |
0.72 |
0.86 |
0.63 |
0.82 |
|
|
6. Six days post-operative |
Delayed ICU admit |
{Home, Home Care, Institutional Care, PACU, Hospital Ward, ICU} |
0.56 |
0.87 |
0.53 |
0.84 |
Table 3: Comparison of 30-day and 90-day mortality predictions by all models, in time order.
|
Model |
30-day Mortality |
90-day Mortality |
|
1. Procedure Scheduled |
||
|
CPM |
0.70 |
0.71 |
|
CCI |
0.69 |
0.69 |
|
Quan CCI |
0.71 |
0.68 |
|
Elixhauser |
0.71 |
0.73 |
|
Quan Elixhauser |
0.68 |
0.69 |
|
2. Morning of surgery |
||
|
CPM |
0.76 |
0.78 |
|
ASA |
0.65 |
0.62 |
|
POSPOM |
0.63 |
0.65 |
|
3. Procedures complete |
||
|
CPM |
0.79 |
0.78 |
|
S-MPM |
0.72 |
0.68 |
|
RSI |
0.58 |
0.67 |
|
RQI |
0.70 |
0.71 |
|
4. Anesthesia complete |
||
|
CPM |
0.84 |
0.82 |
|
SAS |
0.76 |
0.70 |
References
- Birkhead GS, Klompas M, Shah NR (2015) Uses of electronic health records for public health surveillance to advance public health. Annu Rev Public Health 36: 345-359. [Crossref]
- Adler Milstein J, DesRoches CM, Kralovec P, Foster G, Worzala C et al. (2015) Electronic Health Record Adoption In US Hospitals: Progress Continues, But Challenges Persist. Health Aff (Millwood) 34: 2174-2180. [Crossref]
- Charlson ME, Pompei P, Ales KL, MacKenzie CR (1987) A new method of classifying prognostic comorbidity in longitudinal studies: development and validation. J Chronic Dis 40: 373-383. [Crossref]
- Arrigo RT, Kalanithi P, Cheng I, Alamin T, Carragee EJ et al. (2011) Charlson score is a robust predictor of 30-day complications following spinal metastasis surgery. Spine (Phila Pa 1976) 36: E1274-E1280. [Crossref]
- Dekker JW, Gooiker GA, van der Geest LG, Kolfschoten NE, Struikmans H et al. (2012) Use of different comorbidity scores for risk-adjustment in the evaluation of quality of colorectal cancer surgery: does it matter? Eur J Surg Oncol 38: 1071-1078. [Crossref]
- Strand TE, Rostad H, Damhuis RA, Norstein J (2007) Risk factors for 30-day mortality after resection of lung cancer and prediction of their magnitude. Thorax 62: 991-997. [Crossref]
- Saklad M (1941) GRADING OF PATIENTS FOR SURGICAL PROCEDURES. Anesthesiology 2: 281-284.
- Committee on Standards and Practice Parameters, Apfelbaum JL, Connis RT, Nickinovich DG; American Society of Anesthesiologists Task Force on Preanesthesia Evaluation et al. (2012) Practice advisory for preanesthesia evaluation: an updated report by the American Society of Anesthesiologists Task Force on Preanesthesia Evaluation. Anesthesiology 116: 522-538. [Crossref]
- Sathiyakumar V, Molina CS, Thakore RV, Obremskey WT, Sethi MK (2015) ASA score as a predictor of 30-day perioperative readmission in patients with orthopaedic trauma injuries: an NSQIP analysis. J Orthop Trauma 29: e127-e132. [Crossref]
- Woodfield JC, Beshay NM, Pettigrew RA, Plank LD, van Rij AM (2007) American Society of Anesthesiologists classification of physical status as a predictor of wound infection. ANZ J Surg 77: 738-741. [Crossref]
- Yeoh CJ, Fazal MA (2014) ASA Grade and Elderly Patients With Femoral Neck Fracture. Geriatr Orthop Surg Rehabil 5: 195-199. [Crossref]
- Lavelle EA, Cheney R, Lavelle WF (2015) Mortality Prediction in a Vertebral Compression Fracture Population: the ASA Physical Status Score versus the Charlson Comorbidity Index. Int J Spine Surg 9: 63. [Crossref]
- Novotny V, Froehner M, Koch R, Zastrow S, Heberling U et al. (2016) Age, American Society of Anesthesiologists physical status classification and Charlson score are independent predictors of 90-day mortality after radical cystectomy. World J Urol 34: 1123-1129. [Crossref]
- Gawande AA, Kwaan MR, Regenbogen SE, Lipsitz SA, Zinner MJ (2007) An Apgar score for surgery. J Am Coll Surg 204: 201-208. [Crossref]
- Regenbogen SE, Ehrenfeld JM, Lipsitz SR, Greenberg CC, Hutter MM et al. (2009) Utility of the surgical apgar score: validation in 4119 patients. Arch Surg 144: 30-37. [Crossref]
- Assifi MM, Lindenmeyer J, Leiby BE, Grunwald Z, Rosato EL et al. (2012) Surgical Apgar score predicts perioperative morbidity in patients undergoing pancreaticoduodenectomy at a high-volume center. J Gastrointest Surg 16: 275-281. [Crossref]
- Prasad SM, Ferreria M, Berry AM, Lipsitz SR, Richie JP et al. (2009) Surgical apgar outcome score: perioperative risk assessment for radical cystectomy. J Urol 181: 1046-1053. [Crossref]
- Zighelboim I, Kizer N, Taylor NP, Case AS, Gao F et al. (2010) "Surgical Apgar Score" predicts postoperative complications after cytoreduction for advanced ovarian cancer. Gynecol Oncol 116: 370-373. [Crossref]
- Fitz Henry J (2011) The ASA classification and peri-operative risk. Ann R Coll Surg Engl 93: 185-187. [Crossref]
- Elixhauser A, Steiner C, Harris DR, Coffey RM (1998) Comorbidity measures for use with administrative data. Med Care 36: 8-27. [Crossref]
- Quan H, Sundararajan V, Halfon P, Fong A, Burnand B et al. (2005) Coding algorithms for defining comorbidities in ICD-9-CM and ICD-10 administrative data. Med Care 43: 1130-1139. [Crossref]
- Sessler DI, Sigl JC, Manberg PJ, Kelley SD, Schubert A et al. (2010) Broadly applicable risk stratification system for predicting duration of hospitalization and mortality. Anesthesiology 113: 1026-1037. [Crossref]
- Dalton JE, Kurz A, Turan A, Mascha EJ, Sessler DI et al. (2011) Development and validation of a risk quantification index for 30-day postoperative mortality and morbidity in noncardiac surgical patients. Anesthesiology 114: 1336-1344. [Crossref]
- Le Manach Y, Collins G, Rodseth R, Le Bihan Benjamin C, Biccard B et al. (2016) Preoperative Score to Predict Postoperative Mortality (POSPOM): Derivation and Validation. Anesthesiology 124: 570-579. [Crossref]
- Glance LG, Lustik SJ, Hannan EL, Osler TM, Mukamel DB et al. (2012) The Surgical Mortality Probability Model: derivation and validation of a simple risk prediction rule for noncardiac surgery. Ann Surg 255: 696-702. [Crossref]
- Deyo RA, Cherkin DC, Ciol MA (1992) Adapting a clinical comorbidity index for use with ICD-9-CM administrative databases. J Clin Epidemiol 45: 613-619. [Crossref]
- Hanley JA, McNeil BJ (1982) The meaning and use of the area under a receiver operating characteristic (ROC) curve. Radiology 143: 29-36. [Crossref]
- Japkowicz N (2000) The Class Imbalance Problem: Significance and Strategies. Proceedings of the 2000 International Conference on Artificial Intelligence.
- Austin SR, Wong YN, Uzzo RG, Beck JR, Egleston BL (2015) Why Summary Comorbidity Measures Such As the Charlson Comorbidity Index and Elixhauser Score Work. Med Care 53: e65-e72. [Crossref]
- de Groot V, Beckerman H, Lankhorst GJ, Bouter LM (2003) How to measure comorbidity. a critical review of available methods. J Clin Epidemiol 56: 221-229. [Crossref]
- Quan H, Li B, Couris CM, Fushimi K, Graham P et al. (2011) Updating and validating the Charlson comorbidity index and score for risk adjustment in hospital discharge abstracts using data from 6 countries. Am J Epidemiol 173: 676-682. [Crossref]
- Romano PS, Roos LL, Jollis JG (1993) Adapting a clinical comorbidity index for use with ICD-9-CM administrative data: differing perspectives. J Clin Epidemiol 46: 1075-1090. [Crossref]
- Sundararajan V, Henderson T, Perry C, Muggivan A, Quan H et al. (2004) New ICD-10 version of the Charlson comorbidity index predicted in-hospital mortality. J Clin Epidemiol 57: 1288-1294. [Crossref]
- van Walraven C, Austin PC, Jennings A, Quan H, Forster AJ (2009) A modification of the Elixhauser comorbidity measures into a point system for hospital death using administrative data. Med Care 47: 626-633. [Crossref]
- Chu YT, Ng YY, Wu SC (2010) Comparison of different comorbidity measures for use with administrative data in predicting short- and long-term mortality. BMC Health Serv Res 10: 140. [Crossref]
- Li P, Kim MM, Doshi JA (2010) Comparison of the performance of the CMS Hierarchical Condition Category (CMS-HCC) risk adjuster with the Charlson and Elixhauser comorbidity measures in predicting mortality. BMC Health Serv Res 10: 245. [Crossref]
- Southern DA, Quan H, Ghali WA (2004) Comparison of the Elixhauser and Charlson/Deyo methods of comorbidity measurement in administrative data. Med Care 42: 355-360. [Crossref]
- Wolters U, Wolf T, Stutzer H, Schroder T (1996) ASA classification and perioperative variables as predictors of postoperative outcome. Br J Anaesth 77: 217-222. [Crossref]
- Goldstein BA, Navar AM, Pencina MJ, Ioannidis JP (2017) Opportunities and challenges in developing risk prediction models with electronic health records data: a systematic review. J Am Med Inform Assoc 24: 198-208. [Crossref]