Journals
Utility of the ADC Map in Identification of Diffusion Restriction on a Background of Basal Ganglia Iron Deposition - T2 Gray Out Effect
A B S T R A C T
Objective: Review T2 signal effects on DWI, including a previously undescribed concept of T2 shortening masking true diffusion restriction on trace DWI images, and the utility of evaluating the ADC/eADC map in these areas using case examples.
Conclusion: Basal ganglia iron deposition can potentially mask true diffusion restriction when trace DWI images are viewed in isolation. Review of the ADC/eADC map is helpful for identifying diffusion restriction in these cases.
I N T R O D U C T I O N
Diffusion Weighted Imaging-Basic Concepts
Tissue Diffusibility is expressed as the Apparent Diffusion Coefficient (ADC), which can be calculated on a voxel by voxel basis according to the formula below by comparing the signal intensity at differing diffusion gradient strengths (B value) [1,2]: ADC = (-ln SI/〖SI〗_(B=0) )/B This formula may be displayed graphically by plotting the natural logarithm of the signal intensity within a region of interest in relation to the B value (see Figure 1). The ADC Value corresponds to the slope of this curve. As free diffusion of protons is increased (diffusion is facilitated) the slope of the curve becomes steeper. As diffusion is restricted, ADC decreases, and the slope of the curve becomes flattened (Figure 1). The ADC is calculated for each voxel and is displayed on the ADC map which is generated in most brain imaging protocols. Similarly, another technique to display tissue diffusibility without the contribution of T2 contrast is generation of exponential images (eADC) [2]. In this method, DWI signal intensity is divided by the signal intensity of the same voxel at B0. In contrast to the ADC map where reduced diffusion is displayed as hypointense, on eADC restricted diffusion is displayed as hyperintense.
T2 Signal effects on DWI
DWI is inherently T2 weighted, and therefore changes in T2 signal intensity directly influence DWI signal, independent of tissue diffusion characteristics. Calculation of an ADC map eliminates the T2 contribution to the image and displays true tissue diffusibility. Three concepts related to T2 signal effects on DWI have previously been described and are known pitfalls amongst most Neuroradiologists. These concepts are referred to as T2 Shine-through, T2 Wash-out, and T2 Black-out and will be described in the following sections.
T2 Shine-Through
Perhaps the most well-known pitfall in interpretation of T2 effects on DWI is the concept of T2 shine-through [1, 2]. In this case, T2 signal is elevated to such a degree that it is displayed as hyperintense on B1000 images, although no true restricted diffusion is present (Figure 2). This is easily recognized by reviewing the ADC or eADC images in the corresponding region of interest to confirm facilitated diffusion.
T2 Wash-Out
The T2 wash-out effect refers to a concept in which pathology is displayed as isointense relative to normal brain parenchyma resulting from a balance of T2 prolongation and facilitated diffusion (Figures 2a and 3) [1, 2]. This effect is commonly seen in areas of vasogenic edema.
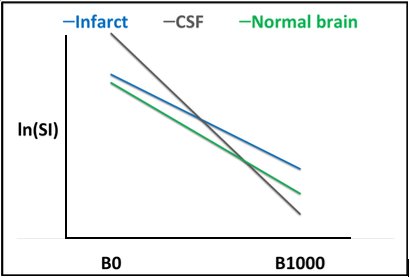
Figure 1: ADC calculation displayed graphically. The natural logarithm of the signal intensity within a region of interest may be plotted in relation to the B value, and the ADC value within that region of interest corresponds to the slope of the curve. The curve for CSF (gray) is the steepest as there is free diffusion of protons (diffusion is facilitated). As ADC value decreases (diffusion is restricted), the slope of this curve will become increasingly flattened. When compared to CSF, the curve for normal brain parenchyma (green) is relatively flat. Within areas of acute infarct (blue), diffusion is further restricted, and the curve is flattest.
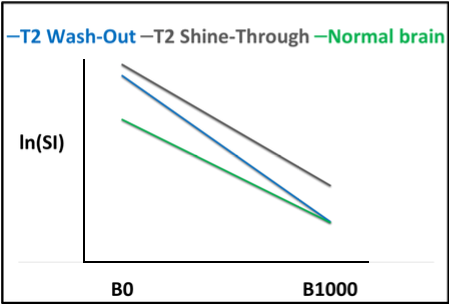
Figure 2(A): T2 Shine-Through and T2 Wash-Out are displayed graphically. In the case of T2 shine-through (gray), the slope of the curve is steep relative to normal brain indicating facilitated diffusion. However, the signal displayed on B1000 is elevated relative to normal brain parenchyma and “shines through”. Similarly, in the case of T2 wash-out (blue) diffusion is facilitated, although on B1000 the signal approximates that of normal brain parenchyma and is “washed out”.
T2 Black-Out
Another well described T2 signal effect on DWI is referred to as “T2 black-out” [1-3]. In regions of signal void due to susceptibility, ADC and eADC cannot be accurately calculated. This effect is often seen in the setting of hemorrhage or dense calcification (Figure 4).
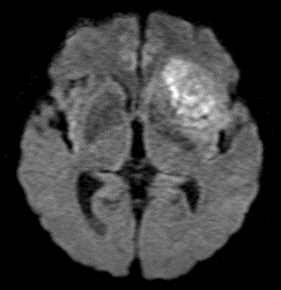
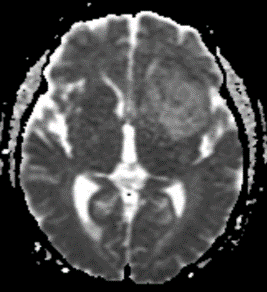
Figure 2(B,C): In this patient with Glioblastoma, hyperintense signal on B1000 (B) corresponds to high signal on ADC (C), indicating facilitated diffusion and T2 shine-through.
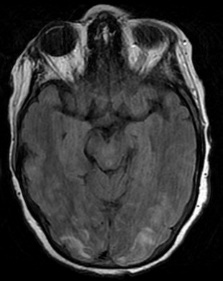
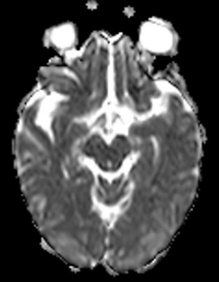

Figure 3: T2 wash-out effect. In this patient with PRES, edema results in increased T2 signal on FLAIR (A), while ADC (B) shows corresponding facilitated diffusion. B1000 (C) images are isointense relative to normal brain or “washed out”.
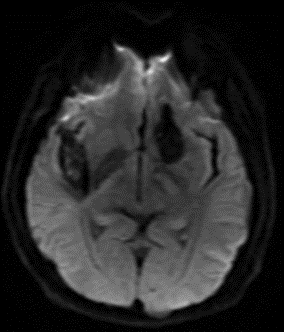

Figure 4: T2 black-out. In this patient with multiple cavernous malformations, ADC (B) cannot be calculated due to susceptibility effects resulting in loss of signal.

Figure 5: T2 gray out effect displayed graphically. The “grayed out” curve is relatively flat when compared to normal brain (diffusion is restricted). The slope is the same as the infarct curve, however, is shifted down due to T2 shortening effects from iron deposition. Signal approximates normal brain at B1000 and thus is “grayed out” (circled).
Discussion
T2 Gray-Out Effect
In patients presenting with acute infarction, DWI trace images are normally highly sensitive for infarct detection due to the combined effects of restricted diffusion and T2 prolongation producing highly conspicuous hyperintense signal, often described as being “lightbulb bright”. Therefore, it is common practice that the trace images are often reviewed in isolation without particular attention to the ADC/eADC map, and these are usually reserved for problem solving when the trace images are abnormal. A previously undescribed concept is the balance of reduced tissue diffusibility in areas of T2 shortening. T2 shortening within basal ganglia structures due to iron deposition is a commonly encountered finding, particularly in older patients. As is shown in the following case examples (Figure 6-10), this T2 effect can be problematic for detection of true diffusion restriction in the setting of acute infarct. In these cases, this balance of diffusion and T2 signal within the basal ganglia can mask true diffusion restriction. This effect can be explained by plotting the natural logarithm of signal intensity in relation to the B value as seen in (Figure 5).
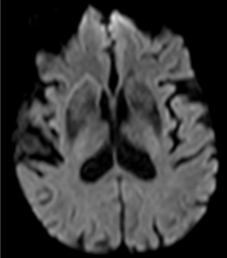
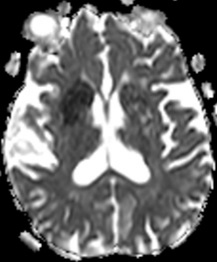
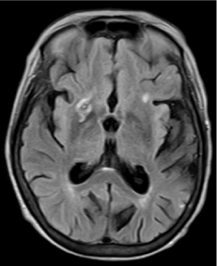
Figure 6: T2 Gray out effect in a 60-year-old male presenting as a stoke alert. B1000 image at the level of the basal ganglia (A) shows T2 shortening related to iron deposition within the basal ganglia with no definite evidence of acute infarct and was reported as such prospectively. Retrospective review of the ADC map (B) at the same level shows obvious diffusion restriction within the right putamen and caudate head. FLAIR image one month later (C) confirms the evolving infarct in this location.
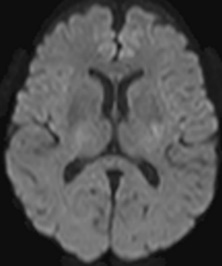

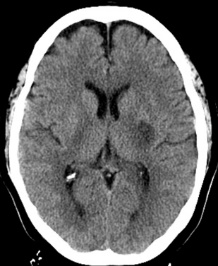
Figure 7: 60-year-old female with right hemiparesis and left M1 occlusion on concurrent MRA (not shown). B1000 (A) shows questionable signal alteration in left putamen on a background of iron deposition which was not appreciated prospectively. Review of the eADC (B) confirms true diffusion restriction. Head CT 4 days later (C) again confirms the evolving infarct in this location.
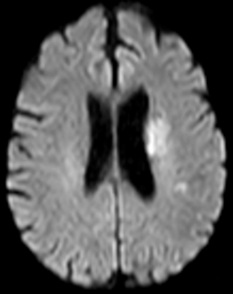
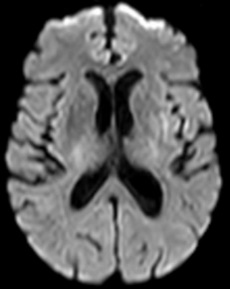
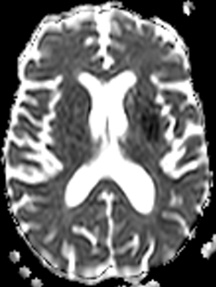
Figure 8: 79-year-old male with left M1 occlusion. There is obvious acute MCA distribution infarct identified (A), however there is additional diffusion restriction in the left putamen that is not apparent on B1000 due to gray-out effect (B) but is readily identified on ADC (C) and eADC (not shown).


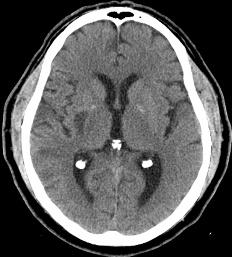
Figure 9: 63-year-old male with acute onset of left sided weakness one hour prior to admission. No definite diffusion abnormality is identified on B1000 (A). Obvious diffusion restriction is identified in the right posterior putamen on eADC (B). Concurrent MRA showed right M1 occlusion and patient was referred for emergent mechanical thrombectomy. Follow up CT performed 5 days later shows evolving infarct in this location (C).
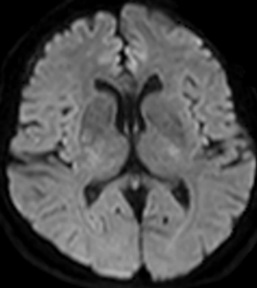
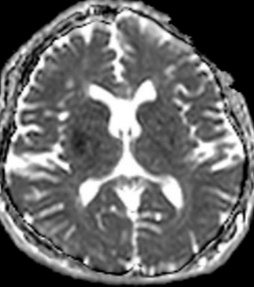
Figure 10: 64-year-old female with left sided weakness. B1000 (A) shows bilateral basal ganglia T2 shortening without definitive infarct. ADC map at the same level (B) confirms diffusion restriction in the right posterior putamen.
Conclusion
In the setting of acute infarction, trace DWI (B1000) images are traditionally thought of as the most sensitive means of detecting infarction given the additive diffusion and T2 prolongation effects resulting in “lightbulb bright” signal. Typically, the eADC/ADC maps are reviewed for problem solving when an abnormality is detected on B1000, and often are not reviewed independently. This case series proposes the concept of a “T2 gray-out” effect on trace DWI images. In patients which there is T2 shortening within the basal ganglia due to iron deposition, this case series suggests that there is utility in reviewing the eADC/ADC map for detection of otherwise occult infarction based on the review of the trace images alone.
Article Info
Article Type
Research ArticlePublication history
Received: Mon 04, Mar 2019Accepted: Wed 03, Apr 2019
Published: Fri 19, Apr 2019
Copyright
© 2023 JP Karis. This is an open-access article distributed under the terms of the Creative Commons Attribution License, which permits unrestricted use, distribution, and reproduction in any medium, provided the original author and source are credited. Hosting by Science Repository.DOI: 10.31487/j.RDI.2019.02.01
Author Info
Corresponding Author
JP KarisBarrow Neurological Institute, Phoenix, AZ
Figures & Tables
References
- Hiwatashi A, Kinoshita T, Moritani T, Wang HZ, Shries DA et al. (2003) Hypointensity on diffusion-weighted MRI of the brain related to T2 shortening Hiwatashi and susceptibility effects. AJR Am J Roentgenol 181: 1705-1709. [Crossref]
- Moritani T, Ekholm S, Westesson PL. Diffusion Weighted MR Imaging of the Brain. Springer 2005: 11-18.
- Maldjian JA, Listerud J, Moonis G, Siddiqi F (2001) Computing diffusion rates in T2-dark hematomas and areas of low T2 signal. AJNR Am J Neuroradiol 22: 112-118. [Crossref]
- Schaefer PW, Grant PE, Gonzalez RG (2000) Diffusion-Weighted MR imaging of the brain. Radiology 217: 331-345. [Crossref]