Journals
Vascular phantom examination for trans-arterial CT angiography (CTA) to depict small arteries
A B S T R A C T
Purpose: Vascular phantom study to examine the potential of trans-arterial CT angiography (TACTA) using a 64 multi-detector rows CT (64-MDCT) for depiction of small arteries.
Material and Methods: Non-diluted contrast medium (Iopamidol 300, contains 300 mgI/mL), 2 folds diluted contrast medium (CM), 4 folds, 8, 16, 32, 64 were filled in each small tube 0.1 mm, 0.2 mm, 0.5 mm in inner diameter. These tubes were placed in a cubic cup filled with 64 folds diluted CM. Axial CT image 0.5 mm in thickness was obtained using a 64-MDCT and observed with window width of 700. This window width was preferably and often used in our institution when we observed TACTA images. The visibility of each tube was judged by discussion and agreement between 2 interventional radiologists, and classified into 3 categories; visible, faintly visible, invisible.
Results: 0.1 mm tube filled with non-diluted CM was faintly visible. 0.2 mm tube filled with 1-2 folds diluted CM was visible, and that filled with 4 folds diluted CM was faintly visible. 0.5 mm tubes filled with1-8 folds diluted CM were visible, and that filled with 16 folds diluted CM was faintly visible. The rests were invisible.
Conclusion: TACTA using a 64-MDCT had a potential to depict small arteries 0.1 mm in diameter. Filling of denser CM in arteries enabled depiction of smaller arteries.
K E Y W O R D S
trans-arterial CT angiography, small artery, phantom study
I N T R O D U C T I O N
Although DSA depicts only vessels and stained organs/tumors, CT depicts both vessels and surrounding structures clearly. Moreover, CT image data are volumetric and three dimensional. It was reported that CT during hepatic angiography (CTHA) superiorly detected extrahepatic small arteries branching from proximal hepatic artery compared with DSA [1]. Trans-arterial CT angiography (TACTA) could depict smaller arteries compared with trans-venous CT, and depiction of smaller arteries enables more precise and effective prediction of catheter position for trans-arterial interventional procedures before super-selective advancement of a catheter. In one report about trans-aortic CTA using 2 folds diluted contrast medium (CM), the detectable small artery was considered as 0.5 mm or more in diameter [2]. However, in another manuscript about TACTA using non-diluted CM, it was reported that small artery 0.2 mm or less was depicted [3].
The purpose of this phantom study is to investigate the potential of TACTA to depict small arteries and the influence of CM concentration on depiction of them.
Material and Methods
Preparation of Diluted Contrast Medium
Non-diluted CM (Iopamiron 300; contains 300 mg Iodine per mL, Iopamidol, Bayer, Osaka) and 2, 4, 8, 16, 32, 64 folds diluted CM was filled in each 10-mL plastic syringe. All 7 syringes were scanned using a 64 multi-detector rows CT (MDCT), and the CT value of each CM was measured.
Vascular Phantom Simulating Small Arteries
A cubic cup including 3 sizes of small polyimide plastic tubes (MicroLumen, FL, USA) was prepared as a vascular phantom (Fig. 1). The inner diameter of the tubes and wall thickness were 0.1, 0.2, 0.5 mm, and 0.02, 0.04, 0.04 mm, respectively. Next, CM in each syringe was filled in each tube of each diameter, the cubic cup was filled with 64 folds diluted CM, and axial image of tubes was obtained using a 64-MDCT.
CT Scanning
A 64 multi-detector rows CT (64-MDCT, Aquilion 64, Toshiba medical, Tokyo) with 0.5 mm detector elements was used for scanning. The scan parameters were 0.5 seconds/rotation, 300mA/second in tube current with 120 kV in tube voltage, and 0.81 pitch table movement. Image reconstruction parameters were 0.5 mm in width and interval, 320 mm in field of view, and 512 by 512 in image matrix. The size of an image pixel was 0.63 mm.
Image Analysis
The CT image of the vascular phantom was observed with window width of 700 (Fig 2). This window width was preferably used to observe clinical images of TACTA in our institution. Visibility of each tube was classified into 3 categories by discussion and agreement between 2 interventional radiologists; visible, faintly visible, invisible. The purpose for use of 7th tubes, filled with 64 folds diluted CM (same CM around the tubes in the vascular phantom), was to examine the influence of tube wall on the visibility of tube. Filling of 64 folds diluted CM in the vascular phantom was intended to simulate slightly enhanced soft tissue surrounding the artery such as liver parenchyma.
Results
Analytical statistics
The CT values of non-diluted (1 fold) CM, 2 folds diluted CM, 4 folds, 8, 16, 32, 64 were 5787 HU, 3173, 1698, 953, 463, 270, 138, respectively.
0.1 mm tube filled with non-diluted CM was faintly visible. 0.2 mm tube filled with 1-2 folds diluted CM was visible, and that filled with 4 folds diluted CM was faintly visible. 0.5 mm tubes filled with 1-8 folds diluted CM were visible, and that filled with 16 folds diluted CM was faintly visible. The rests were invisible (Fig 2).
Any tubes filled with 64 folds diluted CM were invisible. Thus, the wall of each tube did not give any influence on the visibility of tube filled with CM.

Fig. 1: Polyimide plastic tubes Polyimide plastic tubes were shown with a measuring device. The inner diameter of each tube was 0.1 mm, 0.2 mm, and 0.5 mm, respectively.

Fig. 2: Axial CT image of the phantomThe width of the phantom was 7 cm, and the phantom was filled with 64 folds diluted CM. Each row was consisted with 7 tubes. The tubes of the top row were 0.2 mm in inner diameter, those of the middle row were 0.5 mm, and those of the bottom row 0.1 mm. The distance between each row was 1 cm and the interval between each tube was 5 mm. The tubes of the right column were filled with non-diluted contrast medium, those of second one from the right were filled with 2 folds diluted CM, those of third one with 4 folds, 4th one with 8, 5th with 16, 6th with 32, and 7th with 64.
Fig. 3: Embolization of a small hepatocellular carcinomaThin slice TACTA depicted a small hepatocellular carcinoma nodule (white arrowhead, A) and a small tumor feeding artery (white arrow, A). The CT value of the common hepatic artery was 2900 H.U. A micro balloon could be easily placed adjacent to the nodule referring the TACTA images. Spot radiography during super-selective transcatheter arterial chemoembolization showed the nodule (white arrowhead, B) and a small tumor feeding artery (white arrow, B). The width of the catheter tip (black arrow, B) was 0.64 mm in width, and the diameter of the tumor feeding artery was less than 0.2 mm.
Fig. 4: Embolization of a nasal tumor before surgical resectionTrans-arterial CT angiography was performed via the right external carotid artery while non-diluted contrast medium was injected at a rate of 1.5 mL/sec for 7 seconds. The CT value of the artery was 4900 H.U. MIP image with bone (A), slab-MIP image (B), and thin slice TACTA images (C) showed arterial system and contrast medium pooling in the tumor clearly (black arrow, A, B). Analysis of thin slice CTA images revealed a feeding artery branching from the greater palatine artery (white arrow, B, D). No other feeding arteries were depicted, and we speculated that embolization of the great palatine artery only would be sufficient to eliminate the pooling. Sagittal slab-MIP image with bone structure and axial thin slice CTA image depicted the feeding artery (black arrowhead, B, D), peripheral smaller ones (white arrowheads, B, C) from the tumor feeding artery, and contrast medium pooling in the tumor (black arrow, A, B, D). The diameter of these peripheral small arteries (white arrowhead, B, C) were evaluated as less than 0.2 mm by referring the microcatheter 0.43 mm in inner diameter (large white arrow, D) and these small arteries (white arrowhead, D) depicted on DSA. The microcatheter could be efficiently navigated and placed at the greater palatine artery (white arrow, B, D) referring the TACTA images. No contrast medium pooling was shown after successful coil embolization of the greater palatine artery (white arrow, E). Surgical resection was performed with 200 mL blood loss.
D i s c u s s i o n
TACTA is widely used for evaluation of liver tumors. Since introduction of MDCT, double phase CTHA is preferred to single phase CTHA. First phase CTHA is aimed to obtain three-dimensional volumetric image data of hepatic arterial system, and the second phase one to detect hepatic nodules [4, 5]. The primary aim of traditional CTHA is to detect and characterize small hepatic nodules, and 2-3 folds diluted CM has been widely used [4 – 7]. Because CM is diluted with blood after injection, our study indicates that small artery 0.2 mm or less would not be well depicted when 2 folds diluted CM was injected.
In a report of trans-aortic CTA, 2 folds diluted CM was used, and CT value of artery was approximately 800 HU. The authors described that the minimum diameter of detectable artery was approximately 0.5 mm [2]. In our phantom study, 0.5 mm tubes with 8 folds diluted CM (953 HU) was visible and 0.2 mm tube with 8 folds diluted CM was invisible. Our phantom study well explains clinical data of this trans-aortic CTA study. In a clinical report of TACTA, small peripheral hepatic artery 0.2 mm in diameter was well depicted by injection of non-diluted CM into celiac or superior mesenteric artery at a rate of 5 mL/sec [3]. In our phantom study, 0.2 mm tube filled with 2 folds diluted CM was visible, and the result of this clinical study could be also well explained (Fig 3). Both clinical studies were done to detect tumor feeding arteries for embolization of hepatocellular carcinoma. Our phantom study showed that depiction of small tumor feeding artery 0.1 mm in diameter on TACTA was potentially possible when non-diluted CM was filled in arteries during CT scanning. This TACTA technique, filling of dense contrast medium in arterial system during CT scanning in order to depict smaller arteries, can be applied to other interventional procedure using TACTA (Fig. 4).
Although numerous CT studies using phantoms were reported according to depiction of small objects, these were focused on accuracy in measuring several millimeter objects [8 - 10]. As far as we know, no report was seen according to depiction of small artery 0.1 mm in diameter.
There were limitations in this study. In our phantom study, the structure surrounding the tubes was liquid and homogeneous. But in human body, the structure surrounding arteries is organ and inhomogeneous. Thus, it should be more difficult to depict small arteries in clinical imaging especially when arteries were surrounded with dense subjects such as bone or strongly enhanced soft tissue. It should be also reminded that 64-MDCT could depict small artery 0.1 mm in diameter, but it could not resolute adjacent small arteries 0.1 mm in diameter. Moreover, the pixel size of CT image matrix was 0.6 mm and small tube 0.1 mm in diameter was depicted as an object 0.6 mm or larger. Thus, small artery could be depicted, but its size could not be measured precisely on TACTA.
In conclusion, TACTA has a potential to depict small artery 0.1 mm in diameter. The key point for good depiction of smaller arteries is filling of denser contrast medium in arteries during CT scanning. Injection of non-diluted contrast medium with high flow rate is one of the simplest methods to achieve this condition.
C o n c l u s i o n
The authors declare that they have no conflicts of interest to report.
Article Info
Article Type
Technical NotePublication history
Received: Mon 19, Mar 2018Accepted: Wed 28, Mar 2018
Published: Mon 02, Apr 2018
Copyright
© 2023 Toshiyuki Irie. This is an open-access article distributed under the terms of the Creative Commons Attribution License, which permits unrestricted use, distribution, and reproduction in any medium, provided the original author and source are credited. Hosting by Science Repository.DOI: 10.31487/j.RDI.2018.10.001
Author Info
Corresponding Author
Toshiyuki IrieDepartment of Radiology, Tsukuba University Hospital Mito Clinical Education and Training Center, Mito Kyodo General Hospital, Japan
Figures

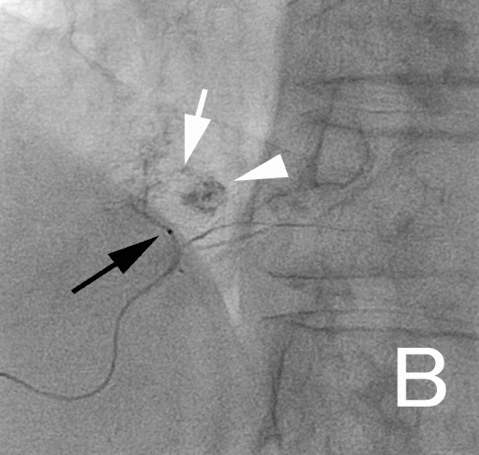

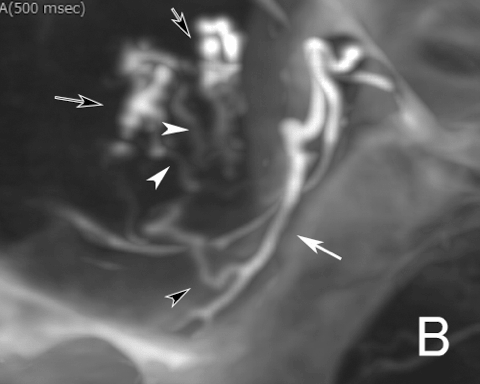


Figure legends
Fig. 1: Polyimide plastic tubes - Polyimide plastic tubes were shown with a measuring device. The inner diameter of each tube was 0.1 mm, 0.2 mm, and 0.5 mm, respectively.
Fig. 2: Axial CT image of the phantom - The width of the phantom was 7 cm, and the phantom was filled with 64 folds diluted CM. Each row was consisted with 7 tubes. The tubes of the top row were 0.2 mm in inner diameter, those of the middle row were 0.5 mm, and those of the bottom row 0.1 mm. The distance between each row was 1 cm and the interval between each tube was 5 mm. The tubes of the right column were filled with non-diluted contrast medium, those of second one from the right were filled with 2 folds diluted CM, those of third one with 4 folds, 4th one with 8, 5th with 16, 6th with 32, and 7th with 64.
Fig. 3: Embolization of a small hepatocellular carcinoma - Thin slice TACTA depicted a small hepatocellular carcinoma nodule (white arrowhead, A) and a small tumor feeding artery (white arrow, A). The CT value of the common hepatic artery was 2900 H.U. A micro balloon could be easily placed adjacent to the nodule referring the TACTA images. Spot radiography during super-selective transcatheter arterial chemoembolization showed the nodule (white arrowhead, B) and a small tumor feeding artery (white arrow, B). The width of the catheter tip (black arrow, B) was 0.64 mm in width, and the diameter of the tumor feeding artery was less than 0.2 mm.
Fig. 4: Embolization of a nasal tumor before surgical resection - Trans-arterial CT angiography was performed via the right external carotid artery while non-diluted contrast medium was injected at a rate of 1.5 mL/sec for 7 seconds. The CT value of the artery was 4900 H.U. MIP image with bone (A), slab-MIP image (B), and thin slice TACTA images (C) showed arterial system and contrast medium pooling in the tumor clearly (black arrow, A, B). Analysis of thin slice CTA images revealed a feeding artery branching from the greater palatine artery (white arrow, B, D). No other feeding arteries were depicted, and we speculated that embolization of the great palatine artery only would be sufficient to eliminate the pooling. Sagittal slab-MIP image with bone structure and axial thin slice CTA image depicted the feeding artery (black arrowhead, B, D), peripheral smaller ones (white arrowheads, B, C) from the tumor feeding artery, and contrast medium pooling in the tumor (black arrow, A, B, D). The diameter of these peripheral small arteries (white arrowhead, B, C) were evaluated as less than 0.2 mm by referring the microcatheter 0.43 mm in inner diameter (large white arrow, D) and these small arteries (white arrowhead, D) depicted on DSA. The microcatheter could be efficiently navigated and placed at the greater palatine artery (white arrow, B, D) referring the TACTA images. No contrast medium pooling was shown after successful coil embolization of the greater palatine artery (white arrow, E). Surgical resection was performed with 200 mL blood loss.
References
1. Ozaki K, Kobayashi S, Matsui O, Minami T, Koda W, et al. (2017) Extrahepatic Arteries Originating from Hepatic Arteries: Analysis Using CT During Hepatic Arteriography and Visualization on Digital Subtraction Angiography. Cardiovasc Intervent Radiol 1568-1576. [Crossref]
2. Minamiguchi H, Kawai N, Sato M, Ikoma A, Sanda H, et al. (2013) Hepatoma feeding arteriogram created by CT during aortography using IVR 64-multidetector-row CT for catheterization in transcatheter arterial chemoembolization for hepatocellular carcinoma. Jpn J Radiol 31: 428–436. [Crossref]
3. Irie T, Kuramochi M, Takahashi N (2016) Diameter of main tumor feeding artery of a hepatocellular carcinoma: Measurement at the entry site into the nodule. Hepatology Research 46: E100–E104.
4. Tanaka T, Arai Y, Inaba Y, Inoue M, Nishiofuku H, et al. (2014) Current role of hybrid CT/angiography system compared with C-arm cone beam CT for interventional oncology. Br J Radiolo 87: 20140126. [Crossref]
5. Tsurusaki M, Sugimoto K, Fujii M, Fukuda T, Matsumoto S, et al. (2007) Combination of CT during arterial portography and double-phase CT hepatic arteriography with multi-detector row helical CT for evaluation of hypervascular hepatocellular carcinoma. Clinical Radiology 62: 1189-1197. [Crossref]
6. Inaba Y, Arai Y, Kanematsu M, et al. (2000) Revealing hepatic metastases from colorectal cancer: value of combined helical CT during arterial portography and CT hepatic arteriography with a unified CT and angiography system. AJR 174: 955-961. [Crossref]
7. Irie T, Takeshita K, Wada Y, Kusano S, Terahata S, et al. (1995) CT evaluation of hepatic tumors: comparison of CT with arterial portography, CT with infusion hepatic arteriography, and simultaneous use of both techniques. AJR 164: 1407-1412. [Crossref]
8. Fei X, DuX, Yang Q, Shen Y, Li P, et al. (2008) 64-MDCT coronary angiography: Phantom study of effects of vascular attenuation on detection of coronary stenosis. AJR 191: 43-49. [Crossref]
9. Almutairia AM, Suna Z, Nga C, Al-Safranb ZA, Al-Mullab AA, et al. (2010) Optimal scanning protocols of 64-slice CT angiography in coronary artery stents: An in vitro phantom study. European Journal of Radiology 74: 156-160. [Crossref]
10. Suzuki S, Furui S, Kaminaga T (2005) Accuracy of automated CT angiography measurement of vascular diameter in phantoms: Effect of size of display field of view, density of contrast medium, and wall thickness. AJR 184: 1940-1944. [Crossref]